Want it harder? Hide the model answer and work each phase in a scratchpad against its time budget, then reveal and score yourself. Or simply read on: the checkpoints below work either way.
How Do You Match Millions of Riders with Drivers in Under 3 Seconds?
Imagine this challenge: Every second, thousands of people open an app expecting to see available cars near them. Within 3 seconds, you must find the optimal driver from potentially hundreds nearby, calculate the fare, estimate arrival time, and begin the match—all while the driver and rider are both moving.
This is Uber—a real-time, location-based marketplace operating in 15,000+ cities across 70+ countries. It's not just a taxi app. It's a masterclass in geospatial indexing, dynamic pricing, and building systems that make split-second decisions at global scale.
Marketplace
- Monthly Active Platform Consumers: 208 Million (Q2 2026)
- Drivers and couriers: ~10 Million monthly active (2026)
- Daily Trips: ~43 Million (rides + deliveries, Q2 2026)
- Cities: 15,000+
- Countries: 70+
Real-time (this design's targets and estimates)
- Location updates/second: ~500K at peak (estimated below)
- Match latency target: < 3 seconds
- ETA accuracy target: ~95% within 3 minutes
- Driver ping response: < 15 seconds
Data
- Events processed/day: Hundreds of billions
- Data pipelines: 200,000+
- ML models in production: Thousands
- Kafka messages/day: Trillions
Infrastructure
- Microservices: Thousands
- Data centers: Multiple (hybrid cloud)
- Engineers: Thousands (of ~34,000 employees, end of 2025)
Business (2025)
- Gross Bookings: $193.5 Billion
- Revenue: $52.0 Billion
- Trips completed: ~13.6 Billion (in 2025 alone)
This is the system we'll design today—and discover how Uber matches riders with drivers faster than you can blink.
Uber runs ~43 million trips a day and must match a rider in under 3 seconds: 1.5 million online drivers ping every 4 s (375,000 updates a second) against ~1,000 trip requests. Pings land in an in-memory H3 index, Pricing quotes an upfront fare, Matching scores nearby drivers and offers the ride for 15 s, and the trip is created exactly once. The deep dives cover H3 rings, surge with smoothing, weighted scoring and ETAs, then city sharding, silent drivers and GPS drift, a regional failover and idempotent trip completion.
The Interview Begins#
You walk into the interview room. The interviewer smiles and gestures to the whiteboard.
"Thanks for coming in. Today we're going to design a ride-hailing platform like Uber. I'm interested in how you think about real-time matching, geospatial systems, and dynamic pricing. Please think out loud—this is collaborative."
They write on the whiteboard:
Requirements
- Match riders with nearby drivers in real-time (< 3 seconds)
- Track driver locations continuously
- Calculate accurate ETAs and fares
- Implement dynamic (surge) pricing
- Support multiple ride types (UberX, Pool, Black, etc.)
- Handle global scale across thousands of cities
"Take a few minutes to think about this, then walk me through your approach. We have about 45 minutes."
Phase 1: Requirements Clarification (5 minutes)#
Before diving in, you take a breath and start asking questions.
Your Questions#
"Before I start designing, let me clarify some requirements. What's our target scale—how many concurrent users and trips?"
"Think global scale. Assume 150+ million monthly riders, 7+ million drivers and 30 million ride trips per day."
"For the matching process, what's the acceptable latency? How fast should a rider see available cars?"
"Under 3 seconds from request to match. Users should see nearby drivers update in real-time as they move."
"How frequently do drivers report their location?"
"Every 4 seconds while online. That's hundreds of thousands of location updates per second globally."
"What about the ETA calculation? How accurate does it need to be?"
"Within 3 minutes of actual arrival time, 95% of the time. This is critical for user trust."
"Perfect. Let me summarize the requirements."
Functional Requirements#
1. Rider experience
- See nearby available drivers on map
- Request a ride with pickup and destination
- Get fare estimate before confirming
- Track driver en route to pickup
- Track trip progress to destination
- Rate driver after trip
2. Driver experience
- Go online/offline
- Receive ride requests with accept/decline
- Navigate to pickup and destination
- See earnings and trip history
- Receive surge notifications
3. Matching
- Find optimal driver for rider request
- Consider distance, ETA, driver rating
- Support ride types (X, Pool, Black, XL)
- Handle driver cancellations gracefully
4. Pricing
- Calculate base fare (time + distance)
- Apply dynamic surge pricing
- Show upfront pricing to riders
- Split fares for Pool rides
Non-Functional Requirements#
1. Latency
- Match request to driver assignment: < 3 seconds
- Location update processing: < 100ms
- ETA calculation: < 500ms
- Fare calculation: < 200ms
2. Availability
- 99.99% for ride requests
- Graceful degradation (show cached data if needed)
- Multi-region failover
3. Scale
- 30 million trips/day
- Hundreds of thousands of location updates/second
- Peak handling (New Year's Eve, major events)
4. Consistency
- Strong consistency for trip state
- Eventual consistency for driver locations
- Exactly-once trip creation
Phase 2: Back of the Envelope Estimation (5 minutes)#
"Let me work through the numbers to understand the scale."
Before the numbers: which write rate dominates?
Assume 7.4 million ride drivers, about 20% online at once, each sending its location every 4 seconds. Assume riders take 30 million trips a day, with a 3× evening peak. Work out location updates per second and trip requests per second. Which one shapes the storage design?
One strong answer
- Locations: 7.4M × 20% ≈ 1.5M online; 1.5M ÷ 4 s = 375,000 updates/s, around 500,000 at peak.
- Trips: 30M × 3 ÷ 86,400 s ≈ 1,000 requests/s at peak.
- Locations win by roughly 500 to 1. They need an in-memory store that simply overwrites each driver's latest position and tolerates a few seconds of staleness. Trips are few but must be strongly consistent and created exactly once, so they belong in a durable, transactional store.
Traffic Estimation#
- Ride requests
- Daily ride trips (assumed; Uber's ~43M/day also counts deliveries): 30 million
- Peak multiplier: 3x (evening rush, events)
- Peak trips/hour: 30M × 3 / 24 = 3.75 million
- Peak trips/second: ~1,000 trips/second
- Location updates
- Active ride drivers (assumed; Uber's ~10M also counts couriers): 7.4 million
- Online at any time: ~20% = 1.5 million
- Update frequency: Every 4 seconds
- Location updates/second: 1.5M / 4 = 375,000/second
- Peak (~1.33x, a third above the baseline): ~500,000 updates/second
Storage Estimation#
- Trip data
- Trips per day: 30 million
- Trip record size: ~5 KB (locations, timestamps, fare)
- Daily trip storage: 30M × 5 KB = 150 GB/day
- Yearly: ~55 TB/year
- Location history
- Updates per second: 500,000
- Bytes per update: ~100 bytes (lat, lng, timestamp,
driver_id) - Daily location data: 500K × 100 × 86,400 = 4.3 TB/day
- Retention (7 days): ~30 TB
Key Metrics Summary#
Traffic
- Peak trip requests: 1,000/second
- Location updates: 500,000/second
- API requests (total): ~5 million/second
Storage
- Trip data: 150 GB/day
- Location data: 4.3 TB/day
- Total (with retention): ~100 TB active
Compute
- Matching decisions: 1,000/second
- ETA calculations: ~50,000/second (up to 50 candidates scored per match, at 1,000 matches a second)
- Surge calculations: Per cell, every 30 seconds
Requirements and estimation
Q1/3 Using the lesson's numbers (~1.5M drivers online), product wants driver pings every 2 seconds instead of 4. What baseline load should the Location Service plan for?
Answer & explanation
Answer: B
1.5M drivers / 2 s = 750,000 updates/s, double today's 375,000/s baseline (and ~1M/s at the same peak, a third higher). Halving the interval doubles the write rate; it does not change the number of drivers online.
Q2/3 Why does the design demand strong consistency for trip state but accept eventual consistency for driver locations?
Answer & explanation
Answer: C
A slightly stale dot on the map self-corrects at the next ping. Trip creation must be exactly-once: two trips for one request means double charges or two drivers sent.
Q3/3 Which data stream drives the storage design, and how does the estimate handle it?
Answer & explanation
Answer: D
Location pings are roughly 30x the trip data by volume. A short retention window (~30 TB for 7 days) keeps that stream bounded.
Phase 3: High-Level Design (10 minutes)#
"Now let me sketch out the high-level architecture."
Sketch it first: one ride request, end to end
A rider taps Request. Which services take part, in what order, and which of their data needs strong consistency versus "fresh within a few seconds"?
One strong answer
- Location service: ingests driver pings and keeps an in-memory geospatial index of available drivers. Eventually consistent; a few seconds stale is fine.
- Pricing: quotes an upfront fare using the surge for the pickup cell.
- Dispatch / matching: finds candidates near the pickup from the index, scores them with ETAs, and offers the trip to the best driver, waiting up to 15 seconds before moving to the next.
- Trip service: when a driver accepts, creates the trip exactly once and runs its state machine (matched, en route, on trip, completed). Strongly consistent.
- Events: every state change is published to Kafka for analytics, ETAs and surge.
System Architecture#
%% title: Uber high-level architecture
flowchart TD
  subgraph CL["Clients"]
    RA@{ icon: "sd:phone", label: "Rider App" }
    DA@{ icon: "sd:car", label: "Driver App" }
  end
  GW["API GATEWAY<br/>Rate Limiting · Auth · Routing · Load Balancing"]:::edge
  RA ==>|"WebSocket + HTTP"| GW
  DA ==>|"WebSocket + HTTP"| GW
  subgraph US["Uber services"]
    direction TB
    subgraph RT["Real-time layer"]
      direction TB
      WS["WebSocket Manager"]:::service
      LS["Location Service"]:::hot
      PS["Push Service"]:::service
    end
    subgraph CS["Core services"]
      direction TB
      MS["Matching Service"]:::core
      TS["Trip Service"]:::core
      PR["Pricing Service"]:::core
      ET["ETA Service"]:::core
      MP["Map Service"]:::core
      PY["Payment Service"]:::core
      MS ~~~ ET
      TS ~~~ MP
      PR ~~~ PY
    end
    subgraph DL["Data layer"]
      direction TB
      SP@{ icon: "tech:spanner", label: "Spanner (Trips)" }
      RD@{ icon: "tech:redis", label: "Redis (Locations)" }
      CA@{ icon: "tech:cassandra", label: "Cassandra (History)" }
      KF@{ icon: "tech:kafka", label: "Kafka (Events)" }
    end
    H3@{ icon: "sd:hexagons", label: "GEOSPATIAL INDEX<br/>H3 Hexagonal Grid (Driver Location Index)" }
    RT ~~~ CS
    CS ~~~ DL
    DL ~~~ H3
  end
  GW ==> RT
  class RA,DA client
  class SP,CA,H3 store
  class RD cache
  class KF queue
Data Flow: Requesting a Ride#
%% title: Ride request flow
sequenceDiagram
  autonumber
  participant R as Rider app
  participant G as API Gateway
  participant L as Location Service
  participant M as Matching Service
  participant D as Driver app
  participant T as Trip Service
  participant P as Pricing Service
  R->>G: RIDER OPENS APP · WebSocket connection established
  L-->>R: See nearby drivers (from Location Service)
  R->>G: RIDER REQUESTS RIDE · POST /ride-request {pickup, destination, ride_type}
  G->>M: API Gateway → Matching Service
  M->>L: Query Location Service for nearby drivers
  L-->>M: nearby drivers
  Note over M: Filter by ride type, rating, availability<br/>Calculate ETA for each candidate<br/>Score and rank candidates<br/>Select optimal driver
  M->>D: DRIVER NOTIFICATION · push via WebSocket
  Note over D: Driver has 15 seconds to accept
  opt IF ACCEPTED
    D-->>M: accept
    M->>T: Trip Service creates trip record
    M->>P: Pricing Service calculates fare
    T-->>R: trip details
    T-->>D: trip details
    Note over R,D: Navigation begins
  end
  loop DURING TRIP · every 4 seconds
    D-)L: driver location update
    L-)R: real-time progress (ETA recalculated continuously)
  end
  Note over T,P: TRIP COMPLETION<br/>Calculate final fare · Process payment<br/>Request ratings · Update driver availability
Note over R,P: TOTAL LATENCY: < 3 seconds (request to driver notification)High-level design
Q1/3 A ride request reaches the chosen driver's phone 2 seconds after the rider taps "Request", and the driver accepts 10 seconds later. Was the < 3 s target missed?
Answer & explanation
Answer: A
The flow explicitly measures total latency from request to driver notification. Human accept time is bounded separately by the 15 s timeout.
Q2/3 Where should each online driver's current position live, given ~500,000 updates/second at peak?
Answer & explanation
Answer: D
Current positions are hot, overwritten every 4 seconds and read on every match: an in-memory store fits. Spanner's strong consistency is reserved for trips; Cassandra holds history, not the live index.
Q3/3 Why do both apps keep a WebSocket open instead of polling the API?
Answer & explanation
Answer: B
Dispatch is server-initiated: a driver must get a request within seconds, and riders see positions every 4 seconds. Polling either lags or floods the gateway with empty responses.
Phase 4: Deep Dives (20 minutes)#
"Let's dive deeper. Tell me about the geospatial indexing system."
Who is near me?
1.5 million drivers are moving all the time. How would you answer "which available drivers are within about 2 km of this rider?" in under 100 ms without checking every driver?
One strong answer
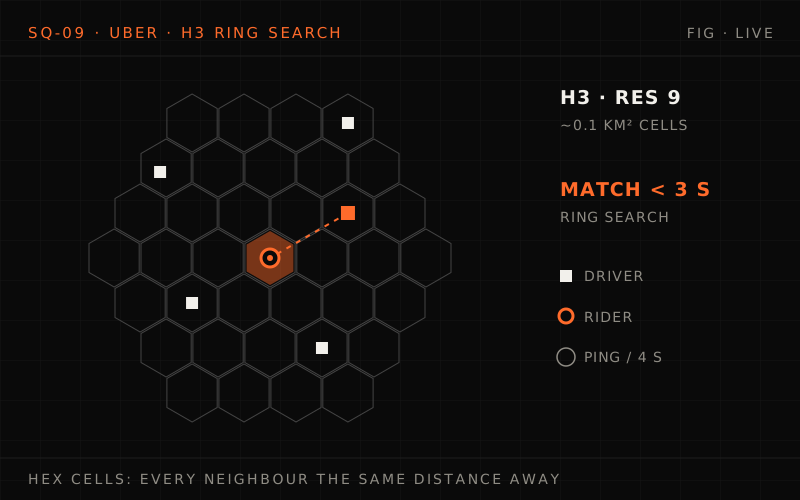
- Bucket the map: turn every location into a cell ID (an H3 hexagon at about street-block size) and keep cell → set of available drivers in memory, updated on every ping. A driver only moves between sets when they cross into a new cell.
- Search rings: look in the rider's cell, then the ring of neighbouring cells around it (k = 1, then k = 2…) until there are enough candidates.
- Then be precise: compute real distance and ETA only for those few dozen candidates.
- Why hexagons: every neighbour is the same distance from the centre, so rings of cells approximate circles well.
- Shard by geography: a city's index lives near that city.
Deep Dive 1: H3 Geospatial Indexing (Week 1 Concepts)#
The Problem#
Finding nearby drivers
- "Find all drivers within 2km of this location"
- Naive approach: Check distance to ALL drivers
- With 1.5M online drivers: Too slow
Requirements
- Sub-100ms lookups
- Works globally (not just one city)
- Handles drivers that are constantly moving
- Efficient for both sparse and dense areas
The Solution: H3 Hexagonal Grid#
Why hexagons?
- Squares: 2 different neighbor distances (edge vs corner)
- Triangles: 3 different neighbor distances
- Hexagons: 1 uniform distance to ALL neighbors (ok)
A hexagon A surrounded by its six neighbors B, C, D, E, F, G: all neighbors (B,C,D,E,F,G) are equidistant from A.
H3 resolution levels
| Resolution | Cell area | Scale |
|---|---|---|
| 0 | ~4.36 million km² | continent scale |
| 7 | ~5.16 km² | city district |
| 9 | ~0.105 km² (~105,000 m², edge ~200 m) | street block ← a common choice for matching |
| 15 | ~0.9 m² | precise location |
Hierarchical structure
Each hexagon subdivides into ~7 child hexagons. Parent cells contain children (useful for aggregation).
- Resolution 7 (city)
- Resolution 8 (neighborhood)
- Resolution 9 (street block)
- Resolution 10 (building level)
- Resolution 9 (street block)
- Resolution 8 (neighborhood)
Every 4-second ping maps a driver to one resolution-9 H3 cell and moves it between cell sets only when it crosses a cell edge; its driver hash expires 30 s after pings stop. A request reads the rider's cell, then rings k = 1 and k = 2, skips busy drivers and sorts the rest by real distance. Candidates are scored (0.4 ETA, 0.2 rating, 0.2 acceptance, 0.2 wait), the best is offered the ride for 15 s, then the next.
Implementation#
# geospatial/h3_location_index.py

"""
H3-Based Location Index for Uber

Uses Uber's open-source H3 hexagonal grid system for
efficient geospatial queries.
"""

from dataclasses import dataclass
from typing import List, Set, Optional
import h3
import redis


@dataclass
class DriverLocation:
    driver_id: str
    latitude: float
    longitude: float
    timestamp: float
    ride_types: List[str]
    rating: float
    is_available: bool


class H3LocationIndex:
    """
    Location index using H3 hexagonal grid.

    Key insight: Convert 2D lat/lng to 1D H3 cell ID
    for O(1) lookups instead of O(n) distance calculations.

    Applies concepts:
    - Week 1: Partitioning strategies
    - Week 4: Caching for low-latency lookups
    """

    # Resolution 9: ~0.1 km² hexagons (edge ~200 m), good for urban areas
    DEFAULT_RESOLUTION = 9

    def __init__(self, redis_client: redis.Redis):
        self.redis = redis_client
        self.resolution = self.DEFAULT_RESOLUTION

    def update_driver_location(self, driver: DriverLocation) -> None:
        """
        Update driver location in the index.

        Called every 4 seconds per driver.
        Must be extremely fast (< 10ms).
        """
        # Convert lat/lng to H3 cell
        cell_id = h3.latlng_to_cell(
            driver.latitude,
            driver.longitude,
            self.resolution
        )

        # Remove from old cell (if moved)
        old_cell = self.redis.hget(f"driver:{driver.driver_id}", "cell")
        if old_cell and old_cell != cell_id:
            self.redis.srem(f"cell:{old_cell}", driver.driver_id)

        # Add to new cell
        self.redis.sadd(f"cell:{cell_id}", driver.driver_id)

        # Store driver details
        self.redis.hset(f"driver:{driver.driver_id}", mapping={
            "cell": cell_id,
            "lat": driver.latitude,
            "lng": driver.longitude,
            "ts": driver.timestamp,
            "available": int(driver.is_available),
            "rating": driver.rating
        })

        # Set TTL for automatic cleanup if driver goes offline
        self.redis.expire(f"driver:{driver.driver_id}", 30)

    def find_nearby_drivers(
        self,
        latitude: float,
        longitude: float,
        radius_km: float = 2.0,
        ride_type: str = "UberX",
        limit: int = 10
    ) -> List[DriverLocation]:
        """
        Find available drivers near a location.

        Uses H3 k-ring to get nearby cells, then fetches
        drivers from those cells.
        """
        # Get center cell
        center_cell = h3.latlng_to_cell(
            latitude, longitude, self.resolution
        )

        # Widen ring by ring (k = 1, then 2, ...) until there are enough
        # candidates, up to the radius. At resolution 9 the edge is ~200 m,
        # so adjacent cell centres are ~0.35 km apart (sqrt(3) x edge):
        # 2 km allows up to k = 6
        max_k = int(radius_km / 0.35) + 1

        candidates = []
        searched = set()
        for k in range(1, max_k + 1):
            # Only the cells this ring adds (grid_disk includes the centre)
            ring_cells = set(h3.grid_disk(center_cell, k)) - searched
            searched |= ring_cells
            for cell_id in ring_cells:
                driver_ids = self.redis.smembers(f"cell:{cell_id}")
                for driver_id in driver_ids:
                    driver_data = self.redis.hgetall(f"driver:{driver_id}")
                    # Hash values come back as strings: "0" is truthy, so
                    # compare explicitly (decode_responses=True assumed)
                    if driver_data and driver_data.get("available") == "1":
                        candidates.append(self._to_driver_location(
                            driver_id, driver_data
                        ))
            if len(candidates) >= limit:
                break   # enough drivers: stop widening

        # Sort by distance and return top matches
        candidates.sort(
            key=lambda d: self._haversine_distance(
                latitude, longitude, d.latitude, d.longitude
            )
        )

        return candidates[:limit]

    def get_drivers_in_cell(self, cell_id: str) -> Set[str]:
        """Get all driver IDs in a specific H3 cell."""
        return self.redis.smembers(f"cell:{cell_id}")

    def _haversine_distance(
        self, lat1: float, lng1: float,
        lat2: float, lng2: float
    ) -> float:
        """Calculate distance between two points in km."""
        from math import radians, sin, cos, sqrt, atan2

        R = 6371  # Earth's radius in km

        lat1, lng1, lat2, lng2 = map(
            radians, [lat1, lng1, lat2, lng2]
        )

        dlat = lat2 - lat1
        dlng = lng2 - lng1

        a = sin(dlat/2)**2 + cos(lat1) * cos(lat2) * sin(dlng/2)**2
        c = 2 * atan2(sqrt(a), sqrt(1-a))

return R * cDeep Dive 2: Dynamic Surge Pricing (Week 5 Concepts)#
"How does surge pricing work?"
The Problem#
Scenario: Friday night, 11 PM, downtown
- Rider requests: 500/minute
- Available drivers: 50
- Result: 10-minute wait times, unhappy users
Without surge pricing
- Drivers don't know demand is high
- No incentive to drive to busy areas
- Riders wait forever or can't get a ride
With surge pricing
- Higher prices attract more drivers
- Some riders defer (reducing demand)
- Market reaches equilibrium faster
The Solution: Real-Time Surge Calculation#
Input signals
- Ride requests in H3 cell (last 5 minutes)
- Available drivers in cell + neighbors
- Historical demand patterns (time, day, events)
- Current trip completion rate
- Weather data
Surge calculation
demand_supply_ratio = requests / available_drivers
| Ratio | Surge |
|---|---|
| < 1.0 | 1.0 (no surge) |
| = 2.0 | ≈ 1.5x |
| = 4.0 | ≈ 2.5x |
| > 10.0 | cap (e.g., 5.0x) |
Smoothing
- Don't change surge too rapidly (confusing for users)
- Use exponential moving average
- Gradually ramp up and down
Visualization
City map with H3 cells colored by surge (rows of the hex grid, left to right):
| Row | Cell surge values |
|---|---|
| 1 | 1.0 · 1.2 · 1.0 |
| 2 | 1.0 · 2.5 · 1.5 |
| 3 | 1.2 · 3.0 · 1.2 |
| 4 | 1.0 · 2.0 · 1.5 |
| 5 | 1.0 · 1.2 · 1.0 |
Legend: 1.0x = No surge (gray) · 1.5x = Light surge (yellow) · 2.5x = Medium surge (orange) · 3.0x = High surge (red)
Implementation#
# pricing/surge_service.py

"""
Dynamic Surge Pricing Service

Calculates real-time surge multipliers based on
supply-demand imbalance in each H3 cell.
"""

from dataclasses import dataclass
from typing import Dict, Optional
from datetime import datetime, timedelta
import h3


@dataclass
class SurgeConfig:
    min_surge: float = 1.0
    max_surge: float = 5.0
    update_interval_seconds: int = 30
    smoothing_factor: float = 0.3  # For exponential moving average
    demand_window_minutes: int = 5


@dataclass
class CellSurge:
    cell_id: str
    surge_multiplier: float
    demand_count: int
    supply_count: int
    updated_at: datetime


class SurgePricingService:
    """
    Calculate surge pricing per H3 cell.

    Key principles:
    - Higher demand → higher surge
    - More drivers → lower surge
    - Smooth transitions (no sudden jumps)
    - Respect max cap (emergencies, PR concerns)

    Applies concepts:
    - Week 5: Eventual consistency (surge propagates)
    - Week 8: Real-time analytics pipeline
    """

    def __init__(
        self,
        config: SurgeConfig,
        location_index,
        demand_tracker,
        cache
    ):
        self.config = config
        self.location_index = location_index
        self.demand_tracker = demand_tracker
        self.cache = cache

        # Surge curve parameters (tuned via ML)
        self.surge_curve = [
            (1.0, 1.0),   # ratio 1.0 → surge 1.0
            (1.5, 1.25),  # ratio 1.5 → surge 1.25
            (2.0, 1.5),   # ratio 2.0 → surge 1.5
            (3.0, 2.0),   # ratio 3.0 → surge 2.0
            (5.0, 3.0),   # ratio 5.0 → surge 3.0
            (10.0, 5.0),  # ratio 10.0 → surge 5.0 (cap)
        ]

    def get_surge_for_location(
        self,
        latitude: float,
        longitude: float
    ) -> float:
        """Get current surge multiplier for a location."""
        cell_id = h3.latlng_to_cell(latitude, longitude, 9)

        # Check cache first
        cached = self.cache.get(f"surge:{cell_id}")
        if cached:
            return float(cached)

        # Calculate fresh surge
        surge = self._calculate_cell_surge(cell_id)

        # Cache for 30 seconds
        self.cache.setex(f"surge:{cell_id}", 30, surge)

        return surge

    def _calculate_cell_surge(self, cell_id: str) -> float:
        """Calculate surge for a specific H3 cell."""
        # Get demand (requests in last 5 minutes)
        demand = self.demand_tracker.get_request_count(
            cell_id,
            window_minutes=self.config.demand_window_minutes
        )

        # Get supply (available drivers in cell + neighbors)
        nearby_cells = h3.grid_disk(cell_id, 1)  # Cell + 6 neighbors
        supply = sum(
            len(self.location_index.get_drivers_in_cell(c))
            for c in nearby_cells
        )

        # Prevent division by zero
        if supply == 0:
            return self.config.max_surge if demand > 0 else self.config.min_surge

        # Calculate demand/supply ratio
        ratio = demand / supply

        # Map ratio to surge using curve
        raw_surge = self._ratio_to_surge(ratio)

        # Apply smoothing (don't change too fast). The 30 s "surge:"
        # entry has already expired when we get here, so keep the last
        # published value under a longer-lived key.
        previous_surge = self.cache.get(f"surge_last:{cell_id}")
        if previous_surge:
            raw_surge = self._smooth_surge(
                float(previous_surge),
                raw_surge
            )

        # Clamp to bounds
        surge = max(
            self.config.min_surge,
            min(self.config.max_surge, raw_surge)
        )
        self.cache.setex(f"surge_last:{cell_id}", 3600, surge)
        return surge

    def _ratio_to_surge(self, ratio: float) -> float:
        """Convert demand/supply ratio to surge multiplier."""
        # Below the first point (ratio < 1.0): no surge
        if ratio <= self.surge_curve[0][0]:
            return self.surge_curve[0][1]

        # Linear interpolation between curve points
        for i in range(len(self.surge_curve) - 1):
            r1, s1 = self.surge_curve[i]
            r2, s2 = self.surge_curve[i + 1]

            if r1 <= ratio <= r2:
                # Linear interpolation
                t = (ratio - r1) / (r2 - r1)
                return s1 + t * (s2 - s1)

        # Above max ratio
        return self.surge_curve[-1][1]

    def _smooth_surge(
        self,
        previous: float,
        current: float
    ) -> float:
        """Apply exponential moving average for smooth transitions."""
        alpha = self.config.smoothing_factor
        return alpha * current + (1 - alpha) * previous

    def calculate_fare(
        self,
        distance_km: float,
        duration_minutes: float,
        surge: float,
        ride_type: str = "UberX"
    ) -> float:
        """Calculate total fare with surge."""
        # Base rates (vary by city/ride type)
        rates = {
            "UberX": {"base": 2.50, "per_km": 1.20, "per_min": 0.25},
            "UberXL": {"base": 4.00, "per_km": 1.80, "per_min": 0.35},
            "UberBlack": {"base": 8.00, "per_km": 3.00, "per_min": 0.50},
        }

        rate = rates.get(ride_type, rates["UberX"])

        base_fare = (
            rate["base"] +
            rate["per_km"] * distance_km +
            rate["per_min"] * duration_minutes
        )

        # Apply surge
        surged_fare = base_fare * surge

        # Minimum fare
return max(surged_fare, 5.00)H3 indexing and surge pricing
Q1/3 Why does Uber index drivers on hexagons rather than a square grid?
Answer & explanation
Answer: D
Squares have edge and corner neighbors at two different distances, which distorts "within X km" searches. The code still sorts candidates by haversine distance after gathering them from the k-ring.
Q2/3 A cell's previous surge was 1.0x and the raw demand/supply curve now says 3.0x. With the lesson's EMA (alpha = 0.3), what surge is published?
Answer & explanation
Answer: B
EMA = 0.3 x 3.0 + 0.7 x 1.0 = 1.6x. Smoothing ramps surge gradually so prices do not jump in one step and confuse riders.
Q3/3 Surge counts supply as drivers in the cell plus its 6 neighbors, not just the cell itself. What would go wrong with the cell alone?
Answer & explanation
Answer: C
Resolution-9 hexagons are only a few hundred metres across; nearby drivers frequently sit in adjacent cells. Counting only the center cell undercounts supply and inflates the demand/supply ratio.
Deep Dive 3: Matching Algorithm (Week 1 Concepts)#
"How do you match riders with the optimal driver?"
The nearest driver isn't always the best one
Why can "send the request to the closest driver" be a poor policy? What would you do in a busy downtown at rush hour?
One strong answer
- Distance isn't time: the closest car by straight line may be across a river or on a one-way street; rank by ETA.
- Other factors matter: the right ride type, rating, acceptance rate, and fairness to drivers who have waited longest.
- Offer and fall back: offer to the best-scoring driver, wait up to 15 seconds, then move to the next.
- Batch when it's busy: greedy one-at-a-time choices give one rider the nearest car and leave the next with a far one. Collect requests over a short window (say 2 seconds) and solve the assignment for all of them together to minimise total pickup time.
The Problem#
Given
- 1 rider requesting a ride
- 50 nearby available drivers
Find the "best" match considering
- Distance (affects ETA and driver cost)
- Driver rating
- Driver's acceptance rate
- Ride type compatibility
- Fairness (drivers waiting longer get priority)
The Solution: Weighted Scoring with Dispatch#
Step 1: Candidate selection
- Query H3 index for drivers within radius
- Filter: available, correct ride type, not already pinged
Step 2: Scoring
For each candidate, calculate:
score = w1 × ETA_score +
        w2 × rating_score +
        w3 × acceptance_score +
        w4 × wait_time_score
Where:
ETA_score = 1 - (ETA / max_ETA)— closer is betterrating_score = (rating - 4.0) / 1.0— higher is betteracceptance_score = acceptance_rate— higher is betterwait_time_score = min(wait_time_minutes / 30, 1)— longer wait = priority (the code uses seconds:wait_time_seconds / 1800)
Step 3: Dispatch
- Send request to highest-scoring driver
- Wait up to 15 seconds for response
- If declined/timeout → next best driver
Optimization: batch matching
For high-volume periods:
- Collect requests for 2-second windows
- Solve assignment problem (Hungarian algorithm)
- Globally optimize rider-driver pairs
Implementation#
# matching/dispatch_service.py

"""
Rider-Driver Matching Service

Finds optimal driver for each ride request using
weighted scoring and ETA estimation.
"""

from dataclasses import dataclass
from typing import List, Optional, Tuple
from enum import Enum
import asyncio


class MatchResult(Enum):
    MATCHED = "matched"
    NO_DRIVERS = "no_drivers"
    ALL_DECLINED = "all_declined"
    TIMEOUT = "timeout"


@dataclass
class MatchRequest:
    request_id: str
    rider_id: str
    pickup_lat: float
    pickup_lng: float
    destination_lat: float
    destination_lng: float
    ride_type: str


@dataclass
class DriverCandidate:
    driver_id: str
    latitude: float
    longitude: float
    rating: float
    acceptance_rate: float
    wait_time_seconds: int
    eta_seconds: int
    score: float = 0.0


class MatchingService:
    """
    Match riders with optimal drivers.

    Uses weighted scoring to balance multiple factors:
    - ETA (user experience)
    - Driver rating (quality)
    - Acceptance rate (reliability)
    - Wait time (fairness to drivers)

    Applies concepts:
    - Week 1: Partitioning (H3-based driver lookup)
    - Week 2: Timeouts and retries
    """

    # Scoring weights (tuned via ML/experimentation)
    WEIGHTS = {
        "eta": 0.4,
        "rating": 0.2,
        "acceptance": 0.2,
        "wait_time": 0.2
    }

    DRIVER_RESPONSE_TIMEOUT = 15  # seconds
    MAX_CANDIDATES = 10

    def __init__(
        self,
        location_index,
        eta_service,
        driver_service,
        notification_service
    ):
        self.location_index = location_index
        self.eta_service = eta_service
        self.driver_service = driver_service
        self.notifications = notification_service

    async def find_match(
        self,
        request: MatchRequest
    ) -> Tuple[MatchResult, Optional[str]]:
        """
        Find and dispatch to optimal driver.

        Returns (result, driver_id or None)
        """
        # Step 1: Find nearby candidates
        candidates = await self._get_candidates(request)

        if not candidates:
            return (MatchResult.NO_DRIVERS, None)

        # Step 2: Score and rank candidates
        scored = await self._score_candidates(request, candidates)
        scored.sort(key=lambda c: c.score, reverse=True)

        # Step 3: Dispatch to drivers in order
        for candidate in scored[:self.MAX_CANDIDATES]:
            accepted = await self._dispatch_to_driver(
                request, candidate
            )
            if accepted:
                return (MatchResult.MATCHED, candidate.driver_id)

        return (MatchResult.ALL_DECLINED, None)

    async def _get_candidates(
        self,
        request: MatchRequest
    ) -> List[DriverCandidate]:
        """Get available drivers near pickup location."""
        drivers = self.location_index.find_nearby_drivers(
            request.pickup_lat,
            request.pickup_lng,
            radius_km=3.0,
            ride_type=request.ride_type,
            limit=50
        )

        candidates = []
        for driver in drivers:
            if not driver.is_available:
                continue

            # Get driver stats
            stats = await self.driver_service.get_stats(driver.driver_id)

            # Calculate ETA
            eta = await self.eta_service.calculate(
                driver.latitude, driver.longitude,
                request.pickup_lat, request.pickup_lng
            )

            candidates.append(DriverCandidate(
                driver_id=driver.driver_id,
                latitude=driver.latitude,
                longitude=driver.longitude,
                rating=driver.rating,
                acceptance_rate=stats.acceptance_rate,
                wait_time_seconds=stats.wait_time_seconds,
                eta_seconds=eta
            ))

        return candidates

    async def _score_candidates(
        self,
        request: MatchRequest,
        candidates: List[DriverCandidate]
    ) -> List[DriverCandidate]:
        """Calculate match score for each candidate."""
        max_eta = max(c.eta_seconds for c in candidates) or 1

        for candidate in candidates:
            # Normalize scores to 0-1 range
            eta_score = 1 - (candidate.eta_seconds / max_eta)
            rating_score = (candidate.rating - 4.0) / 1.0
            acceptance_score = candidate.acceptance_rate
            wait_score = min(candidate.wait_time_seconds / 1800, 1.0)

            # Weighted sum
            candidate.score = (
                self.WEIGHTS["eta"] * eta_score +
                self.WEIGHTS["rating"] * max(0, rating_score) +
                self.WEIGHTS["acceptance"] * acceptance_score +
                self.WEIGHTS["wait_time"] * wait_score
            )

        return candidates

    async def _dispatch_to_driver(
        self,
        request: MatchRequest,
        candidate: DriverCandidate
    ) -> bool:
        """Send ride request to driver and wait for response."""
        # Mark driver as unavailable (prevent double-dispatch)
        await self.driver_service.set_pending(candidate.driver_id)

        try:
            # Send push notification
            await self.notifications.send_ride_request(
                driver_id=candidate.driver_id,
                request_id=request.request_id,
                pickup_address="123 Main St",  # Would resolve address
                eta_seconds=candidate.eta_seconds
            )

            # Wait for response with timeout
            response = await asyncio.wait_for(
                self.driver_service.wait_for_response(
                    candidate.driver_id,
                    request.request_id
                ),
                timeout=self.DRIVER_RESPONSE_TIMEOUT
            )

            return response == "accepted"

        except asyncio.TimeoutError:
            return False

        finally:
            # Release driver if not matched
await self.driver_service.clear_pending(candidate.driver_id)Deep Dive 4: ETA Prediction (Week 8 Concepts)#
"How do you calculate accurate ETAs?"
The Problem#
Simple distance/speed calculation fails because
- Traffic varies by time of day
- Accidents, road closures
- Weather affects speed
- One-way streets
- Pickup location accessibility (building entrance vs street)
- Historical patterns matter
Uber's DeepETA model
- Our target (this design's SLO, not a published Uber figure): 95% of ETAs within 3 minutes
- Deep-learning model that predicts a correction on top of the routing engine's ETA
Implementation#
# routing/eta_service.py

"""
ETA Prediction Service

Combines routing engine with ML model for accurate
arrival time predictions.
"""

from dataclasses import dataclass
from typing import List, Optional, Tuple
from datetime import datetime


@dataclass
class ETAResult:
    eta_seconds: int
    distance_meters: int
    confidence: float
    route_polyline: str


class ETAService:
    """
    Calculate estimated time of arrival.

    Combines:
    - Graph-based shortest path (baseline)
    - Real-time traffic data
    - ML model adjustments (DeepETA)
    - Historical patterns

    Applies concepts:
    - Week 8: ML pipeline integration
    - Week 4: Caching for repeated queries
    """

    def __init__(
        self,
        routing_engine,
        traffic_service,
        ml_model,
        cache
    ):
        self.routing = routing_engine
        self.traffic = traffic_service
        self.model = ml_model
        self.cache = cache

    async def calculate(
        self,
        origin_lat: float,
        origin_lng: float,
        dest_lat: float,
        dest_lng: float,
        departure_time: Optional[datetime] = None
    ) -> ETAResult:
        """Calculate ETA from origin to destination."""
        departure_time = departure_time or datetime.utcnow()

        # Check cache for recent identical query
        cache_key = self._make_cache_key(
            origin_lat, origin_lng, dest_lat, dest_lng
        )
        cached = self.cache.get(cache_key)
        if cached:
            return cached

        # Step 1: Get baseline route from routing engine
        route = await self.routing.get_route(
            origin_lat, origin_lng,
            dest_lat, dest_lng
        )

        # Step 2: Get current traffic conditions
        traffic_factor = await self.traffic.get_factor(
            route.segments,
            departure_time
        )

        # Step 3: ML model adjustment
        features = self._extract_features(
            route, traffic_factor, departure_time
        )
        ml_adjustment = self.model.predict(features)

        # Step 4: Combine estimates
        base_eta = route.duration_seconds
        traffic_eta = base_eta * traffic_factor
        final_eta = int(traffic_eta * ml_adjustment)

        result = ETAResult(
            eta_seconds=final_eta,
            distance_meters=route.distance_meters,
            confidence=0.95 if traffic_factor < 1.5 else 0.85,
            route_polyline=route.polyline
        )

        # Cache for 60 seconds
        self.cache.setex(cache_key, 60, result)

        return result

    def _extract_features(
        self,
        route,
        traffic_factor: float,
        departure_time: datetime
    ) -> dict:
        """Extract features for ML model."""
        return {
            "distance_km": route.distance_meters / 1000,
            "base_duration_min": route.duration_seconds / 60,
            "traffic_factor": traffic_factor,
            "hour_of_day": departure_time.hour,
            "day_of_week": departure_time.weekday(),
            "is_rush_hour": self._is_rush_hour(departure_time),
            "num_turns": route.num_turns,
            "num_traffic_lights": route.num_traffic_lights,
            "highway_fraction": route.highway_fraction,
        }

    def _is_rush_hour(self, dt: datetime) -> bool:
        """Check if time is during typical rush hour."""
        hour = dt.hour
        is_weekday = dt.weekday() < 5
        morning_rush = 7 <= hour <= 9
        evening_rush = 17 <= hour <= 19
return is_weekday and (morning_rush or evening_rush)Matching and ETA
Q1/3 Why does
_dispatch_to_drivermark the driver as pending before sending the push notification?Answer & explanation
Answer: D
Without the pending flag, two matching requests could both pick the same top-scored driver. The flag prevents double-dispatch and is cleared if the driver declines or times out.
Q2/3 During a rush, requests are batched in 2-second windows and solved as an assignment problem. What does that fix compared with matching one request at a time?
Answer & explanation
Answer: A
Batching trades up to 2 seconds of waiting for a globally better pairing. Each driver still gets one request and can still decline.
Q3/3 The routing engine says 10 minutes at baseline, the traffic factor is 1.5 and the ML adjustment is 1.1. What ETA does the service return?
Answer & explanation
Answer: C
The pipeline multiplies: 10 x 1.5 = 15 minutes with traffic, then x 1.1 from the model = 16.5 minutes. The factors compound; they are not added.
Phase 5: Scaling and Edge Cases#
Scaling Strategies#
Geographic sharding
- Each city/region is a shard
- Location data stays local (low latency)
- Cross-region trips handled specially
Event-driven architecture
- All state changes → Kafka events
- Services react to events asynchronously
- Enables real-time analytics pipeline
Cell-based load balancing
- Hot H3 cells (downtown) get dedicated capacity
- Cold cells share resources
- Dynamic rebalancing based on demand
Hybrid cloud
- Core services historically in Uber's own data centers
- Moving to cloud (Uber signed multi-year deals with Oracle Cloud and Google Cloud in 2023)
- Multi-region active-active
Edge Cases#
Edge case 1: Driver goes offline mid-match
Scenario: Driver selected, then loses connectivity
Handling:
- 15-second timeout for response
- Automatic retry with next best driver
- Driver marked unavailable after 30s silence
Edge case 2: Mass event ending (Concert, Sports)
Scenario: 50,000 people request rides simultaneously
Handling:
- Surge pricing activates (attracts drivers)
- Virtual queue system for fairness
- Pre-positioning drivers before event ends
- Predictive scaling based on event schedule
Edge case 3: GPS drift/inaccuracy
Scenario: Driver appears in wrong H3 cell
Handling:
- Kalman filter smooths location jumps
- Query neighboring cells (k-ring)
- Fall back to larger radius search
Edge case 4: Payment failure
Scenario: Card declined after trip completion
Handling:
- Retry with backup payment method
- Grace period before blocking rider
- Driver always gets paid (Uber absorbs risk)
Scaling and edge cases
Q1/3 Why does geographic sharding (each city or region is a shard) fit Uber so well?
Answer & explanation
Answer: B
Matching, surge and location lookups are inherently local, so a city shard keeps data close and queries single-shard. Load still varies inside a city, which is why hot H3 cells get dedicated capacity; cross-region trips need special handling.
Q2/3 The selected driver's phone loses signal right after the ride request is pushed. What happens next?
Answer & explanation
Answer: D
The dispatch loop treats a timeout like a decline and tries the next candidate. Separately, the driver's 30 s TTL removes them from future searches.
Q3/3 GPS drift places a driver one cell away from where they really are. Which handling keeps them matchable?
Answer & explanation
Answer: A
The search never relies on a single cell: the k-ring covers neighbors, and the filter removes implausible jumps. Finer hexagons would make drift cross more cell borders, not fewer.
Phase 6: Monitoring and Operations#
Marketplace health
| Metric | Value | Reading |
|---|---|---|
| Trips completing/minute | ~21,000 | 20,834 |
| Average ETA accuracy | 94.7% | 94.7% |
| Match success rate | 98.2% | 98.2% |
| Average surge | 1.15x | 1.15x |
Latency
| Metric | Value | Status |
|---|---|---|
| Match time (p50) | 1.8s | on target |
| Match time (p99) | 4.2s | warning |
| Location update processing | 45ms | healthy |
| ETA calculation | 180ms | healthy |
Supply-demand
| Metric | Value |
|---|---|
| Online drivers | 1.2M |
| Active trips | 890K |
| Pending requests | 12K |
| Surge zones (>1.5x) | 847 |
Infrastructure
| Metric | Value | Status |
|---|---|---|
| Kafka lag | < 100ms | healthy |
| Redis hit rate | 99.2% | healthy |
| API error rate | 0.02% | healthy |
| WebSocket connections | 45M |
Alerting Strategy#
CRITICAL (PagerDuty)
- Match success rate < 90%
- Trip completion rate < 95%
- Location service latency > 500ms
- Payment processing failures > 1%
WARNING (Slack)
- Surge zones > 2000 (unusual demand)
- Driver online rate dropping > 10%
- ETA accuracy < 90%
- Kafka consumer lag > 1 minute
INFO (Dashboard)
- Regional traffic patterns
- Driver earnings distribution
- New city launch metrics
Marketplace health
Q1/3 Match time p50 is 1.8 s, but p99 is 4.2 s against a 3 s target. What most often creates that slow tail?
Answer & explanation
Answer: B
The search itself is fast. The time goes into offers: each unanswered offer can cost up to 15 seconds, so declines and silent drivers dominate the tail.
Q2/3 Why is "location service latency > 500 ms" critical while "Kafka consumer lag > 1 minute" is only a warning?
Answer & explanation
Answer: A
Slow or stale positions mean bad matches and wrong ETAs right now. Lag on downstream consumers delays analytics and dashboards, which matters, but not to the rider waiting at the kerb.
Q3/3 The number of surge zones suddenly jumps past 2,000. What should you check first?
Answer & explanation
Answer: B
Surge is a ratio. A big event pushes demand up; an app release that logs drivers out pushes supply down. The fix for each is completely different.
Final Challenge: The Region Fails at Rush Hour#
The interviewer glances at the clock. "Last scenario, and it's an ugly one."
"It's Friday at 6 PM. The region serving a large city goes down, with 200,000 trips in progress and new requests arriving every second. What happens to those trips, and how quickly can people book rides again?"
- One region is gone; another region is healthy
- 200,000 trips are in progress, with fares quoted and drivers driving
- Driver and rider apps are still running and still have GPS
- New ride requests keep arriving
Which state is precious, and which rebuilds itself?
Sort the system's state into what must survive exactly and what can be rebuilt. Then describe the failover from the apps' point of view.
One strong answer
- Precious: trip state. Who is riding with whom, the locked upfront fare and the trip's status are replicated to the other region (active-active), so in-progress trips can be served from there.
- Rebuildable: the location index. It's soft state, and every online driver sends a fresh position every 4 seconds, so the healthy region rebuilds it within a ping cycle or two of the apps reconnecting. No need to replicate it.
- The apps carry on: drivers keep navigating, and both apps hold the current trip locally and keep recording the GPS trail, then resync once they reconnect to the healthy region.
- Make every step idempotent: completing a trip or charging for it is keyed by the trip ID, so calls retried during the failover can't create duplicate trips or double charges.
- New requests: routed to the healthy region and matched as soon as its location index has warmed up; scale that region out ahead of time, because it now carries the extra load.
Final challenge · Quest check
Q1/4 Why doesn't the live driver-location index need to be replicated to the backup region?
Answer & explanation
Answer: B
The index only answers "where are drivers right now?". Fresh pings rebuild it quickly, so replicating it would cost a lot and buy almost nothing.
Q2/4 Which data must survive the failover exactly as it was?
Answer & explanation
Answer: B
Surge, ETAs and locations are recomputed from live data. Trips are commitments to riders and drivers, and they must not be lost, duplicated or re-priced.
Q3/4 During the failover a driver taps "Complete trip" twice because the first call timed out. What prevents a double charge?
Answer & explanation
Answer: C
Exactly-once effects come from idempotent operations: the same trip ID always maps to one completion and one charge, however many times it's requested.
Q4/4 Suppose the failed region served 300,000 online drivers, each pinging every 4 seconds. How many extra location updates a second must the healthy region absorb once their apps reconnect?
Answer & explanation
Answer: B
300,000 ÷ 4 s = 75,000 updates a second on top of the healthy region's own traffic, which is why it needs headroom planned before the outage, not provisioned during it.
Interview Conclusion#
"Excellent work. You've covered the geospatial system, pricing, and matching really well. Any questions?"
"Thank you! I'm curious about how Uber handles the transition when a driver crosses city boundaries—does the surge pricing change mid-trip?"
"Great question. The fare is locked at request time based on pickup location. If surge changes during the trip, the rider pays what was quoted upfront. We introduced upfront pricing specifically to avoid surprises."
Summary: Concepts Applied#
- Week 1: Data at scale
- H3 Partitioning — Geospatial sharding by hexagon
- Geographic sharding — City-level data isolation
- Hot key handling — High-demand cells get dedicated capacity
- Week 2: Failure-first design
- Timeouts — 15s driver response window
- Retries — Automatic failover to next driver
- Circuit breakers — Protect downstream services
- Week 3: Messaging & async
- Kafka — Trillions of events per day
- Event-driven — All state changes as events
- Real-time processing — Flink for surge calculation
- Week 4: Caching
- Redis — Driver locations for sub-ms lookups
- ETA cache — Avoid redundant routing calculations
- Surge cache — 30-second TTL for stability
- Week 5: Consistency
- Strong — Trip state (Spanner)
- Eventual — Driver locations, surge pricing
- Optimistic locking — Prevent double-dispatch
- Week 8: Analytics pipeline
- Real-time — Surge pricing, fraud detection
- Batch — ML model training, demand forecasting
- ML integration — DeepETA, demand prediction
- Week 10: Production readiness
- SLOs — < 3s match, 95% ETA accuracy
- Multi-region — Active-active deployment
- Observability — Real-time marketplace health
Real-time scale
- ~43 million trips a day, rides + deliveries (Q2 2026)
- Hundreds of thousands of location updates per second (our estimate)
- Matching in seconds (this design targets < 3 s)
Innovation
- H3: Open-sourced hexagonal geospatial system
- DeepETA: deep-learning correction on top of routing-engine ETAs
- Dynamic pricing: Real-time market equilibrium
Global complexity
- 15,000+ cities with local regulations
- Multiple products: Rides, Eats, Freight
- ~10 million monthly active drivers and couriers
Data platform
- 200,000+ data pipelines
- Petabytes processed daily
- Thousands of ML models in production
Sources#
Official Uber Engineering:
- Blog
Uber Engineering Blog: https://www.uber.com/blog/engineering/
- Blog
H3 Geospatial Indexing: https://www.uber.com/blog/h3/
- Blog
Fulfillment Platform Re-architecture: https://www.uber.com/blog/fulfillment-platform-rearchitecture/
- Blog
Tech Stack Foundation: https://www.uber.com/blog/tech-stack-part-one-foundation/
H3 Documentation:
- Read
H3 GitHub: https://github.com/uber/h3
- Docs
H3 Documentation: https://h3geo.org/
Architecture:
- Blog
Astronomer - Uber's 200K Data Pipelines: https://www.astronomer.io/blog/airflow-in-action-uber/
- Blog
ByteByteGo - Uber System Design: https://blog.bytebytego.com/
Company figures:
- Read
Uber Q2 2026 Results: https://investor.uber.com/news-events/news/press-release-details/2026/Uber-Announces-Results-for-Second-Quarter-2026/default.aspx
- Read
Uber 2025 Form 10-K: https://www.sec.gov/Archives/edgar/data/1543151/000154315126000015/uber-20251231.htm
- Book
H3 Cell Statistics by Resolution: https://h3geo.org/docs/core-library/restable/
Pricing:
- Read
Uber Marketplace Surge Pricing: https://www.uber.com/us/en/marketplace/pricing/surge-pricing/
- Blog
Uber Dynamic Pricing: https://www.uber.com/en-GB/blog/uber-dynamic-pricing/
Self-Assessment Checklist#
After studying this case study, you should be able to:
- Explain why hexagons are superior to squares for geospatial grids
- Design an H3-based location index with O(1) lookups
- Implement a surge pricing algorithm with demand-supply balancing
- Design a driver-rider matching system with weighted scoring
- Calculate ETAs combining routing, traffic, and ML models
- Handle edge cases: GPS drift, mass events, driver cancellations
- Design for global scale with geographic sharding
- Implement real-time location tracking with WebSockets
- Balance consistency needs (strong for trips, eventual for locations)
- Build observability for a real-time marketplace
- Articulate trade-offs in two-sided marketplace design
This case study covers Uber's architecture for matching millions of riders with drivers in real-time across 15,000+ cities worldwide.
this lesson in shorts · 3
play them all →One idea from this lesson in about a minute each, made for your phone.



- 0/7stages cleared
Follow-up drills
0 of 10 practisedYou presented Uber. Now the interviewer pushes back. Answer each follow-up out loud or in the box, then reveal a strong answer.
“Which write rate shapes your storage design: trips or locations?”
Pushes on · sizing by the dominant write stream
Go deeper · reading trail
all reading →Real write-ups from the teams that built these systems. Each opens on the publisher's site in a new tab.
H3: Uber's Hexagonal Hierarchical Spatial Index
Isaac Brodsky · 2018- What
- Uber introduces H3, its open-source hexagonal grid system.
- Key idea
- Hexagons have uniform neighbour distances and nest across resolutions, which suits analysing supply, demand and pricing by area.
- Why here
- The H3 deep dive of this quest at its source, including why hexagons beat squares for surge pricing cells.
DeepETA: How Uber Predicts Arrival Times Using Deep Learning
2022- What
- How Uber improved its ETA predictions with a deep learning model.
- Key idea
- A routing engine computes an ETA from map data and live traffic, and a deep model predicts the residual correction on top of it.
- Why here
- The ETA deep dive of this quest: physical model plus learned correction, served at very high request rates.
Uber's Fulfillment Platform: Ground-up Re-architecture to Accelerate Uber's Go/Get Strategy
2021- What
- Uber's rebuild of the platform that holds the state of every trip and driver session.
- Key idea
- The old Ringpop-based design favoured availability; the new one moved to a NewSQL store with strongly consistent transactions to support many products.
- Why here
- The matching flow of this quest needs one source of truth for each trip and driver, which is what this platform provides.
New lessons by email
New lessons, side quests and case files as they ship, at most once a week. No spam, unsubscribe anytime.
Discussion · …
Public: everyone reading this lesson sees comments. Be kind and keep it on the material.