Welcome to Week 10#
You've designed the systems. Now you need to run them.
Week 1-9: You learned to design systems
- Data at scale
- Failure handling
- Messaging patterns
- Caching strategies
- Consistency models
- Complete system designs
- Analytics pipelines
- Multi-tenancy
- Security architecture
Week 10: You learn to OPERATE systems
- How do you know it's working?
- How do you deploy without breaking things?
- How do you handle 10x traffic?
- What happens when it breaks at 3am?
- How do you prevent it from breaking again?
The difference between a junior and senior engineer
- Junior: "I built it, it works on my machine"
- Mid: "I built it, it passed the tests"
- Senior: "I built it, I can operate it, I can debug it, I know when it's healthy, and I have a plan for when it breaks"
This week transforms you from someone who builds systems to someone who owns systems in production.
After nine weeks of designing systems, week 10 is about operating them: a senior engineer can operate, debug and tell when a system is healthy, and has a plan for when it breaks. Day by day: a metric becomes an SLI, an SLO, an SLA and a 43.2-minute monthly error budget; metrics, logs and traces share one trace ID; a canary goes from 1% to 100% with automatic rollback; a headroom table shows Elasticsearch breaking first at twice the traffic; and incidents run from detection through mitigation to a postmortem within 48 hours. The capstone is a real-time bidding platform: 10 billion requests a day, 500,000 a second at peak, 100 ms p99 and 99.99% availability.
Week 10 Theme: Production Readiness#
%% title: Production readiness pillars
flowchart TD
  R["RELIABLE SYSTEMS"]:::hot
  R --> S["SLOs<br/>Define Reliability Targets"]:::core
  R --> O["Observability<br/>See Problems"]:::core
  R --> IR["Incident Response<br/>Handle Problems"]:::core
  S --> D["Deployment Strategies<br/>Deploy Safely"]:::service
  O --> C["Capacity Planning<br/>Scale Correctly"]:::service
  IR --> PM["Postmortem & Learning<br/>Improve Always"]:::service
From building to operating
Q1/2 A teammate says "It passed the tests, ship it, we'll figure out monitoring later." By Week 10's bar, what's still missing?
Answer & explanation
Answer: B
"It passed the tests" is the mid-level bar. The senior bar is "I can operate it, I can debug it, I know when it's healthy, and I have a plan for when it breaks." More tests or reviews still tell you nothing about what is happening in production.
Q2/2 Your dashboards are full of data, but nobody can say whether today's 0.3% error rate is acceptable. Which Week 10 pillar fills that gap?
Answer & explanation
Answer: C
SLOs define reliability targets, which is what turns a raw number into "healthy enough" or "not healthy". Observability shows you more data, but it can't tell you what level of errors is acceptable.
Daily Breakdown#
Day 1: SLIs, SLOs, and SLAs — Defining Reliability#
- SLI (Service Level Indicator) — What we measure
- SLO (Service Level Objective) — What we target
- SLA (Service Level Agreement) — What we promise
- Error Budget — How much unreliability we allow
%% title: Example progression
flowchart TD
  M["METRIC<br/>Response latency"]:::service
  SLI["SLI<br/>p99 latency of successful GET requests<br/>Measured at load balancer over 5-minute windows"]:::service
  SLO["SLO<br/>p99 latency #lt; 200ms for 99.9% of 5-minute windows<br/>Over a rolling 30-day period"]:::core
  SLA["SLA<br/>#quot;API requests will complete in under 500ms<br/>99% of the time, or customer receives credit#quot;"]:::external
  EB["ERROR BUDGET<br/>30 days × 24 hours × 60 minutes = 43,200 minutes<br/>0.1% error budget = 43.2 minutes of violations allowed<br/>If we exceed this, we stop features and fix reliability"]:::hot
  M --> SLI --> SLO --> SLA --> EB
This is one illustrative latency example. Day 1 works a different service, the notification API: an availability SLO of 99.9%, 99% of requests within 200ms, and an SLA of 99.5% availability with a 10% service credit. The pattern is the same in both: the SLO is stricter than the SLA.
- Choosing the right SLIs (latency, availability, throughput, correctness)
- Setting realistic SLOs (not too tight, not too loose)
- Error budget policies (what happens when budget depleted)
- SLO-based alerting (alert on budget burn rate, not every error)
- Communicating reliability to stakeholders
Why This Matters: Without SLOs, you don't know if your system is "healthy enough." You'll either over-invest in reliability or under-invest until customers complain.
Day 2: Observability — Seeing Into Production#
- Metrics — Aggregated numerical data (counters, gauges, histograms)
- Logs — Discrete events with context
- Traces — Request flow across services
%% title: Observability stack
flowchart TD
  U@{ icon: "sd:user", label: "USER REQUEST" } --> GW@{ icon: "sd:gateway", label: "API Gateway" }
  GW --> US["User Service"]:::core
  US --> PG@{ icon: "tech:postgresql", label: "Postgres" }
  GW -.->|"Trace ID: abc-123"| TR["TRACE"]:::queue
  TR -.->|"Span: api-gateway → user-service<br/>Duration: 45ms"| US
  TR -.->|"Span: user-service → postgres<br/>Duration: 12ms"| PG
  TR --> ME["METRICS<br/>request_count: +1<br/>latency_p99: 45ms<br/>error_count: 0"]:::queue
  ME --> LG["LOGS<br/>[timestamp] INFO<br/>Request processed"]:::queue
  class U client
  class GW edge
  class PG store
Throughout this flow: {"level":"info","trace_id":"abc-123","message":"User fetched","user_id":123}
- Structured logging (JSON, correlation IDs)
- Metric types (counters, gauges, histograms, summaries)
- Distributed tracing (OpenTelemetry, trace context propagation)
- Dashboard design (USE method, RED method, golden signals)
- Alert design (symptoms vs causes, runbook links)
- Debug workflows (from alert to root cause)
Why This Matters: You can't fix what you can't see. Observability is how you turn "something is slow" into "this specific database query on this specific pod is slow because of this index."
Day 3: Deployment Strategies — Shipping Without Breaking#
- Big Bang — Deploy everything at once (risky)
- Rolling — Replace instances gradually
- Blue-Green — Switch between identical environments
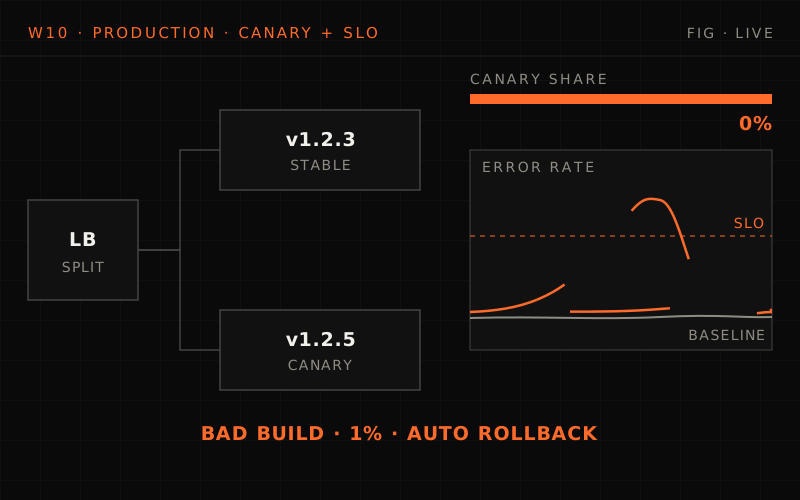
- Canary — Route small percentage to new version
- Feature Flags — Deploy code, activate later
%% title: Canary deployment · stage 1, deploy to 1% of traffic
flowchart TD
  LB@{ icon: "sd:load-balancer", label: "Load Balancer" } -->|"99%"| CUR@{ icon: "sd:servers", label: "v1.2.3 (current)<br/>99 pods" }
  LB -->|"1%"| CAN["v1.2.4 (canary)<br/>1 pod"]:::core
  class LB edge
  class CUR service
Monitor for 15 minutes:
- Error rate: canary vs baseline
- Latency: canary vs baseline
- Business metrics: conversion, etc.
If healthy: Promote to 10% → 50% → 100%. If unhealthy: Automatic rollback to v1.2.3.
- Deployment strategies comparison
- Database migrations (backward compatible, expand-contract)
- Feature flags (gradual rollout, kill switches)
- Rollback strategies (fast rollback, data rollback)
- CI/CD pipeline design
- Change management (deployment windows, freezes)
Why This Matters: The fastest way to cause an outage is a bad deployment. Safe deployment practices are the difference between "we deploy 50 times a day" and "we're scared to deploy."
Day 4: Capacity Planning — Scaling Before You Need To#
Capacity planning process
- Understand current capacity
- Forecast future demand
- Identify bottlenecks
- Plan scaling actions
- Validate with load testing
Capacity planning workflow
1. Measure current state
| Component | Current Load | Max Capacity | Headroom |
|---|---|---|---|
| API Servers | 400 req/s | 600 req/s | 33% |
| PostgreSQL | 2000 QPS | 3000 QPS | 33% |
| Redis | 50% memory | 100% | 50% |
| Elasticsearch | 200 search/s | 400 search/s | 50% |
2. Forecast demand
- Historical growth: 10% month-over-month
- Planned events: Black Friday (5x normal traffic)
- New features: Video upload (high bandwidth)
- Seasonality: Q4 is 2x Q1
3. Identify bottlenecks — at 2x traffic, what breaks first?
- API servers: Scale horizontally — ok
- PostgreSQL: Over its limit at 2x (4000 vs 3000 QPS), so it needs read replicas or sharding
- Redis: Memory hits 100%, so add memory — ok
- Elasticsearch: BOTTLENECK — hits its 400 search/s ceiling with no headroom, and has the longest lead time, so it needs cluster expansion
4. Plan actions
- Q3: Expand Elasticsearch cluster (4 weeks lead time)
- Q4: Add PostgreSQL read replica
- Black Friday: Pre-scale API servers the night before
Key topics
- Load testing (tools, realistic traffic patterns)
- Bottleneck identification (Little's Law, queueing theory basics)
- Vertical vs horizontal scaling decisions
- Auto-scaling configuration (metrics, thresholds, cooldowns)
- Cost optimization (right-sizing, reserved capacity)
- Chaos engineering (verify resilience under load)
Why This Matters: Scaling reactively means outages. Scaling proactively means you're ready when traffic spikes. Capacity planning turns "we might need more servers" into "we need 3 more nodes by October 15."
Day 5: Incident Management — When Things Go Wrong#
- Detection — How do we know there's a problem?
- Response — Who gets paged, what do they do?
- Mitigation — Stop the bleeding
- Resolution — Fix the root cause
- Learning — Prevent recurrence
%% title: Incident response flow
flowchart TD
  D["DETECTION<br/>Alert fires: #quot;Error rate #gt; 5% for 5 minutes#quot;"]:::bad
  T["TRIAGE (5 minutes)<br/>On-call engineer"]:::service
  I["INCIDENT DECLARED (SEV1)<br/>Roles assigned"]:::hot
  M["MITIGATION<br/>Goal: Restore service,<br/>not find root cause"]:::core
  R["RESOLUTION"]:::ok
  P["POSTMORTEM<br/>(within 48 hours)"]:::service
  D --> T --> I --> M --> R --> P
- Triage (on-call engineer): Acknowledge alert · Assess severity (SEV1/SEV2/SEV3) · Check dashboard for scope · Decide: Handle alone or escalate?
- Incident declared — roles assigned: Incident Commander: Coordinates response · Technical Lead: Drives investigation · Communications: Updates stakeholders · Scribe: Documents timeline
- Mitigation: Rollback deployment? · Scale up resources? · Disable feature flag? · Fail over to backup?
- Resolution: Root cause identified · Permanent fix deployed · Incident closed
- Postmortem: Timeline reconstruction · Root cause analysis (5 Whys) · Impact assessment · Action items with owners and deadlines · Blameless discussion
- Severity levels and escalation
- On-call rotations and handoffs
- Runbooks (structured troubleshooting guides)
- Communication during incidents (status pages, stakeholder updates)
- Blameless postmortems (5 Whys, contributing factors)
- Action item tracking and follow-through
Why This Matters: Incidents will happen. The difference between a minor blip and a catastrophic outage is how quickly and effectively you respond. Good incident management is a competitive advantage.
Week 10 Capstone Preview#
Design: A Global Real-Time Bidding Platform#
The final interview: design the ad-tech infrastructure for a company serving 10 billion ad requests per day across 6 continents.
The system: Real-Time Bidding (RTB)
- 100ms end-to-end latency (p99) to receive a bid request, query DSPs, run the auction and return the winner
- 99.99% availability
- 500,000 requests per second at peak
- Real-time budget tracking (can't overspend) and fraud detection
- Complete audit trail for billing
Your job
- Clarify requirements and estimate traffic, data and latency budgets
- Design the architecture and deep-dive budgets, DSP fan-out, audit and fraud
- Define SLIs, SLOs and dashboards for the platform
- Plan for scale events (Super Bowl-size spikes) and edge cases
This capstone tests whether you can
- Think like an SRE, not just a developer
- Anticipate failure modes before they happen
- Design for operability, not just functionality
- Communicate reliability to non-technical stakeholders
What Makes Week 10 Different#
Weeks 1-9 · before week 10
Weeks 1-9: "How do I build this?"
- "The system is done when the feature works"
- "Tests pass, ship it"
- "We'll figure out monitoring later"
- "If it breaks, we'll debug it then"
- "Incidents are unpredictable"
Week 10 · after week 10
Week 10: "How do I know this is working?" · "How do I ship changes safely?" · "How do I handle problems at 3am?" · "How do I prevent future problems?"
- "The system is done when I can operate it"
- "Tests pass, metrics are in, runbook written, ship it"
- "Observability is a requirement, not an afterthought"
- "I've thought through failure modes in advance"
- "Incidents are managed, learnings are captured"
Connections to Previous Weeks#
WEEK 1 (Data at Scale)
Day 4 — SLOs for database performance
- "99th percentile query latency < 50ms"
WEEK 2 (Failure Handling)
Day 3 — Incident response for cascading failures
- "Circuit breaker opened, runbook step 3"
WEEK 3 (Messaging)
Day 3 — Monitoring queue depth and lag
- "Consumer lag > 10K messages triggers alert"
WEEK 4 (Caching)
Day 3 — Capacity planning for cache tier
- "Cache hit rate drop = scale trigger"
WEEK 6 (Notification Platform)
Capstone — Apply this week's SLOs, dashboards and runbooks to the system you designed
- "How would you operate this in production?"
WEEK 9 (Multi-Tenancy)
Day 2 — Per-tenant SLOs and monitoring
- "Enterprise tenant SLO: 99.99%, Standard: 99.9%"
Practical Skills You'll Gain#
- 1. DEFINE RELIABILITY
- Write precise SLIs that measure what matters
- Set SLOs that balance reliability and velocity
- Calculate and manage error budgets
- Translate technical SLOs to business language
- 2. BUILD OBSERVABILITY
- Instrument code with metrics and traces
- Design dashboards that answer questions
- Write alerts that are actionable, not noisy
- Debug production issues systematically
- 3. DEPLOY SAFELY
- Choose the right deployment strategy
- Design backward-compatible migrations
- Use feature flags effectively
- Roll back quickly when needed
- 4. PLAN CAPACITY
- Run meaningful load tests
- Identify bottlenecks before they hit
- Right-size infrastructure
- Prepare for traffic spikes
- 5. MANAGE INCIDENTS
- Respond effectively under pressure
- Communicate clearly during outages
- Run blameless postmortems
- Turn incidents into improvements
The Production Mindset#
%% title: The production mindset
flowchart TD
  A["#quot;How do I build this?#quot;"]:::client --> B["#quot;How do I build this SO THAT...#quot;"]:::core
  B --> C1["...I can tell<br/>when it's healthy"]:::service
  B --> C2["...I can deploy<br/>changes safely<br/>at any time"]:::service
  B --> C3["...I can scale<br/>it when needed<br/>without panic"]:::service
  B --> C4["...I can fix<br/>it when broken<br/>without panic"]:::service
This is what separates SENIOR from JUNIOR engineers. This is what interviewers look for at Staff+ levels. This is what this week teaches you.
Daily Schedule#
| Day | Topic | Key Deliverable |
|---|---|---|
| Day 1 | SLIs, SLOs, SLAs | Define SLOs for a real system |
| Day 2 | Observability | Design metrics, logs, traces strategy |
| Day 3 | Deployment Strategies | Create deployment runbook |
| Day 4 | Capacity Planning | Build capacity model with load test plan |
| Day 5 | Incident Management | Write incident runbook and postmortem template |
| Capstone | The Grand Finale | Design a global real-time bidding platform end to end |
Preparing for Week 10#
This week asks different questions than previous weeks:
| Instead of | Ask |
|---|---|
| "What database?" | "What SLO for database latency?" |
| "How to scale?" | "When do we need to scale?" |
| "Handle failures" | "How do we detect failures?" |
| "Build feature X" | "How do we safely ship feature X?" |
| "Fix the bug" | "How do we prevent this class of bug?" |
Bring your systems
Think about the systems you designed in weeks 6-9:
- Notification Platform (Week 6)
- Search System (Week 7)
- Analytics Pipeline (Week 8)
- Multi-Tenant SaaS (Week 9)
For each one, consider:
- What would the SLOs be?
- What metrics would you monitor?
- How would you deploy changes?
- What's the capacity limit?
- What's the incident response plan?
Summary#
THEME: Production Readiness and Operational Excellence
THE QUESTION: "Can I operate this system in production?"
Daily topics
- Day 1: SLIs, SLOs, SLAs — Define what "healthy" means
- Day 2: Observability — See into your system
- Day 3: Deployment — Ship changes safely
- Day 4: Capacity — Scale before you need to
- Day 5: Incidents — Handle problems effectively
Capstone: The Grand Finale
- Design a global real-time bidding platform, from estimates to SLOs
Key transformation
- From: "I built it"
- To: "I can operate it"
Your journey so far
- Week 1-2: Foundations
- Week 3-5: Building blocks
- Week 6-8: Complete systems
- Week 9: Enterprise requirements
- Week 10: Production excellence
- Week 11, next: AI systems, built on all of the above
After this week, you'll think like a Staff Engineer.
Week 10 begins tomorrow with Day 1: SLIs, SLOs, and SLAs.
Get ready to transform from a builder into an operator.
this lesson in shorts · 1
play them all →One idea from this lesson in about a minute each, made for your phone.
New lessons by email
New lessons, side quests and case files as they ship, at most once a week. No spam, unsubscribe anytime.
Discussion · …
Public: everyone reading this lesson sees comments. Be kind and keep it on the material.