Preface#
Yesterday, you learned to define what "healthy" means with SLOs.
But how do you actually KNOW if you're meeting them?
3:47 AM. Your phone buzzes.
ALERT: SLO violation - API availability dropped to 98.2%
You open your laptop, bleary-eyed. Questions flood your mind:
- Which endpoint is failing?
- Which users are affected?
- When did it start?
- What changed?
- Is it getting worse or recovering?
- What's the root cause?
- How do I fix it?
Without observability, you're blind. You're guessing. You're hoping.
WITH observability
- Dashboard shows:
/api/paymentsendpoint, 5xx errors - Logs show: "Connection refused to payment-service-3"
- Traces show: Requests to payment-service-3 timing out
- Metrics show: payment-service-3 CPU at 100% since 3:42 AM
- Recent deploys show: Config change at 3:40 AM
Root cause found in 5 minutes. Rollback config. Done.
This is the power of observability.
Today, we learn to see inside our systems.
At 3:47 AM availability drops to 98.2%; with observability the dashboard, logs, traces, metrics and a 3:40 config change point to the root cause in five minutes, because monitoring says when something is wrong and observability helps explain why. Metrics are cheap aggregates (counters, gauges, histograms; RED and USE; low-cardinality labels), logs are structured JSON carrying a trace ID, and traces break a request into spans, such as a 100 ms bank call in a 162 ms request; correlating them turns hours into minutes. The stack collects, stores and shows all three in Grafana, dashboards come in executive, service and debug layers, alerts fire on symptoms with a runbook, and debugging runs from dashboard to traces, spans, logs and recent changes.
Part I: Foundations#
Chapter 1: What Is Observability?#
1.1 Observability vs Monitoring#
These terms are often confused. Let's clarify:
MONITORING
"Watching for known problems"
- Pre-defined dashboards
- Pre-defined alerts
- Checks: "Is CPU > 80%? Is error rate > 1%?"
- Good for: Known failure modes
- Limitation: Can't find unknown problems
Example: Alert when database connections > 90% of pool
OBSERVABILITY
"Understanding system behavior from its outputs"
- Ask arbitrary questions
- Explore unknown problems
- Questions: "Why is this user's request slow?"
- Good for: Novel failure modes, debugging
- Enables: Answering questions you didn't anticipate
Example: "Show me all requests from user X in the last hour, grouped by endpoint, colored by latency"
Trade-off: where does per-user detail belong?
You want to answer "why was user-12345's payment slow?" Would you record the user ID as a label on your request-count metric, as a field in your logs, or on the request's trace? What does each choice cost?
One strong answer
- Metrics are cheap because they're aggregated and keep few distinct label values. A user ID label creates a separate series per user, so it doesn't belong there.
- Logs can hold any number of distinct values: put the user ID there, and you can find that user's events.
- Traces show the path one request took and where the time went. Metrics tell you something is wrong; logs and traces tell you what and where for one user.
1.2 The Three Pillars#
%% title: The three pillars of observability
flowchart TD
  O["OBSERVABILITY"]:::core
  O --> M["METRICS<br/>Aggregated Numbers<br/>#quot;What is happening overall?#quot;"]:::service
  O --> L["LOGS<br/>Discrete Events<br/>#quot;What happened exactly?#quot;"]:::service
  O --> T["TRACES<br/>Request Journeys<br/>#quot;What path did this request take?#quot;"]:::service
  M --> ME["Examples:<br/>CPU: 72%<br/>Req/s: 450<br/>p99: 180ms<br/>Errors: 12<br/>AGGREGATED · EFFICIENT"]:::note
  L --> LE["Examples:<br/>Error at 3:42:17<br/>User X logged in<br/>INDIVIDUAL · DETAILED"]:::note
  T --> TE["Examples:<br/>API → Auth → DB → Cache<br/>47ms → 12ms → 3ms → 2ms<br/>CORRELATED · CONTEXTUAL"]:::note
How they work together:
- METRICS alert you: "Error rate spiked to 5%"
- LOGS tell you what: "NullPointerException in PaymentService"
- TRACES show you where: "Failure happens after auth, before DB"
Each pillar has strengths and weaknesses:
| Pillar | Cardinality | Cost | Best For |
|---|---|---|---|
| Metrics | Low | Cheap | Alerting, trends, dashboards |
| Logs | High | Medium | Debugging, audit, compliance |
| Traces | Medium | High | Request flow, latency breakdown |
1.3 Correlation: The Glue#
The real power comes from connecting the three pillars:
- Find the request
- User ID:
user-12345 - Time: ~10 minutes ago
- Search logs:
user_id="user-12345" AND action="payment"
- User ID:
- Get trace ID from log
- Log entry found:
{"trace_id": "abc-123", "error": "timeout"} - Open trace
abc-123in tracing UI
- Log entry found:
- Trace shows the journey
- api-gateway: 2ms — ok
- payment-service: 45ms — ok
- fraud-check: 3ms — ok
- bank-api: TIMEOUT after 30s — fail
- Root cause: Bank API slow
- Check metrics
bank_api_latency_p99shows spike at that time- Other users affected too
- 47 timeouts in last 10 minutes
- Resolution
- Bank API had an incident
- Affected 47 payments
- Auto-retry recovered 38
- 9 need manual intervention
THIS IS OBSERVABILITY IN ACTION. Without correlation, this takes hours. With correlation, it takes minutes.
Chapter 2: Metrics Deep Dive#
2.1 Metric Types#
1. COUNTER
A value that only goes UP (or resets to zero)
Examples:
requests_totalerrors_totalbytes_sent_totalorders_processed_total
Use for: Counting events
Query: rate(requests_total[5m]) → requests per second
2. GAUGE
A value that can go UP or DOWN
Examples:
temperature_celsiusqueue_depthactive_connectionsmemory_used_bytes
Use for: Current state
Query: avg_over_time(queue_depth[5m]) → average queue depth
3. HISTOGRAM
Samples observations and counts them in buckets
Examples:
request_duration_secondsresponse_size_bytesbatch_job_duration_seconds
Buckets: [0.01, 0.05, 0.1, 0.5, 1, 5, 10] seconds
Use for: Latencies, sizes, durations
Query: histogram_quantile(0.99, sum by (le) (rate(request_duration_seconds_bucket[5m])))
4. SUMMARY
Pre-calculated quantiles (less flexible than histogram)
Examples:
request_duration{quantile="0.99"}response_size{quantile="0.5"}
Use for: When you know exactly which quantiles you need
Note: Can't aggregate across instances (prefer histograms)
Estimate: what does one more label cost?
http_requests_total has labels for method (~5 values), endpoint (~100) and status (~20). Each distinct combination of label values is its own time series. How many series is that? A teammate adds user_id for a million users. How many now?
One strong answer
- Today: 5 × 100 × 20 = 10,000 series, which a metrics system handles easily.
- With
user_id: 10,000 × 1,000,000 = 10 billion series, enough to overwhelm the metrics store. - So labels must have a small, bounded set of values. Per-user detail goes in logs and traces.
2.2 Metric Naming and Labels#
# metrics/naming.py

"""
Metric naming conventions and best practices.

Good metric names are:
- Descriptive: What does it measure?
- Consistent: Same format across services
- Unit-aware: Include the unit in the name
"""

from prometheus_client import Counter, Gauge, Histogram, Info
from typing import List

# =============================================================================
# NAMING CONVENTION
# =============================================================================
#
# Format: <namespace>_<subsystem>_<name>_<unit>
#
# Examples:
#   http_requests_total          (counter, no unit needed for counts)
#   http_request_duration_seconds (histogram with unit)
#   process_memory_bytes         (gauge with unit)
#   api_active_connections       (gauge, no unit for count)
#
# Labels should be:
#   - Low cardinality (not user_id, not request_id)
#   - Meaningful dimensions (method, status, endpoint)
#   - Consistent across metrics

# =============================================================================
# GOOD METRIC DEFINITIONS
# =============================================================================

# Counter for requests
http_requests_total = Counter(
    name='http_requests_total',
    documentation='Total number of HTTP requests',
    labelnames=['method', 'endpoint', 'status']
)

# Histogram for latency
http_request_duration_seconds = Histogram(
    name='http_request_duration_seconds',
    documentation='HTTP request latency in seconds',
    labelnames=['method', 'endpoint'],
    buckets=[0.005, 0.01, 0.025, 0.05, 0.1, 0.25, 0.5, 1, 2.5, 5, 10]
)

# Gauge for current state
db_connections_active = Gauge(
    name='db_connections_active',
    documentation='Number of active database connections',
    labelnames=['pool_name']
)

# Business metrics
orders_processed_total = Counter(
    name='orders_processed_total',
    documentation='Total orders processed',
    labelnames=['status', 'payment_method']
)

order_value_dollars = Histogram(
    name='order_value_dollars',
    documentation='Order value in dollars',
    labelnames=['currency'],
    buckets=[10, 25, 50, 100, 250, 500, 1000, 2500, 5000]
)


# =============================================================================
# BAD METRIC DEFINITIONS (DON'T DO THIS)
# =============================================================================

# ❌ BAD: High cardinality labels
# http_requests_total with labels: user_id, request_id, session_id
# This creates millions of time series!

# ❌ BAD: Inconsistent naming
# requestCount (camelCase)
# request-latency (dashes)
# Request_Duration_Ms (mixed case, abbreviated unit)

# ❌ BAD: Missing unit
# http_request_duration (seconds? milliseconds? who knows?)

# ❌ BAD: Too generic
# count (count of what?)
# duration (duration of what?)Safe labels (bounded cardinality)
method: GET, POST, PUT, PATCH, DELETE (~5 values)status: 200, 201, 400, 404, 500 (~20 values)endpoint: /api/users, /api/orders (~100 values)service: user-service, payment-service (~50 values)region: us-east, eu-west (~10 values)tier: free, pro, enterprise (3 values)
Dangerous labels (unbounded cardinality)
user_id: Millions of users = millions of time seriesrequest_id: Unique per request = infinite time seriesemail: Unboundedip_address: Could be millionstimestamp: Never use as a label!
http_requests{method, endpoint, status}= 5 × 100 × 20 = 10,000 series — this is manageable.http_requests{method, endpoint, status, user_id}= 5 × 100 × 20 × 1,000,000 = 10 BILLION series — this will crash your metrics system.
2.3 RED and USE Methods#
RED METHOD (for services)
- R - Rate: Requests per second
- E - Errors: Failed requests per second
- D - Duration: Time per request (usually as histogram)
Use for: APIs, web services, microservices
Example metrics
http_requests_total(rate)http_requests_total{status=~"5.."}(errors)http_request_duration_seconds(duration)
USE METHOD (for resources)
- U - Utilization: % of resource busy
- S - Saturation: Queue depth / waiting work
- E - Errors: Error count
Use for: Databases, queues, caches, CPUs, disks
Example for database
- Utilization: Active connections / max connections
- Saturation: Queries waiting for connection
- Errors: Connection failures, query errors
Example for queue
- Utilization: Consumer throughput / max throughput
- Saturation: Queue depth, consumer lag
- Errors: Processing failures, dead letters
Observability and metrics
Q1/3 Only users on one old mobile app version see slow checkouts. The pre-built dashboards and alerts all look normal. What do you need?
Answer & explanation
Answer: C
Monitoring watches for known failure modes with pre-defined checks, so a novel problem slips past it. Observability lets you ask arbitrary questions you didn't anticipate, such as "show me these users' requests grouped by endpoint".
Q2/3 To debug per-user issues, a teammate adds a
user_idlabel tohttp_requests_total(method x endpoint x status = 10,000 series). What happens with 1M users?Answer & explanation
Answer: A
Total series is the product of all label cardinalities, so one unbounded label turns 10,000 series into billions. Per-user detail belongs in logs and traces; metric labels should stay low-cardinality.
Q3/3 You run 20 API pods and need one fleet-wide p99 latency. Which metric type should each pod expose?
Answer & explanation
Answer: D
Histogram buckets add up across instances, and histogram_quantile then computes p99 from the merged buckets. Summaries pre-calculate per-pod quantiles that can't be aggregated, and a time/count ratio gives the mean, not a percentile.
Chapter 3: Logs Deep Dive#
3.1 Structured Logging#
# logging/structured.py

"""
Structured logging for observability.

Key principles:
1. JSON format for machine parsing
2. Consistent field names
3. Include context (trace_id, user_id, etc.)
4. Appropriate log levels
"""

import json
import logging
import sys
from datetime import datetime, timezone
from typing import Any, Dict, Optional
from contextvars import ContextVar

# Context variables for request-scoped data
_request_context: ContextVar[Dict[str, Any]] = ContextVar(
    'request_context',
    default={}
)


class StructuredFormatter(logging.Formatter):
    """
    Formats log records as JSON for structured logging.
    """

    STANDARD_FIELDS = [
        'timestamp',
        'level',
        'logger',
        'message',
        'trace_id',
        'span_id',
        'user_id',
        'tenant_id',
        'service',
        'environment',
    ]

    def __init__(self, service_name: str, environment: str):
        super().__init__()
        self.service_name = service_name
        self.environment = environment

    def format(self, record: logging.LogRecord) -> str:
        # Base fields
        log_entry = {
            'timestamp': datetime.now(timezone.utc).isoformat().replace('+00:00', 'Z'),
            'level': record.levelname,
            'logger': record.name,
            'message': record.getMessage(),
            'service': self.service_name,
            'environment': self.environment,
        }

        # Add context from request
        ctx = _request_context.get()
        if ctx:
            log_entry['trace_id'] = ctx.get('trace_id')
            log_entry['span_id'] = ctx.get('span_id')
            log_entry['user_id'] = ctx.get('user_id')
            log_entry['tenant_id'] = ctx.get('tenant_id')
            log_entry['request_id'] = ctx.get('request_id')

        # Add extra fields from the log call
        if hasattr(record, 'extra_fields'):
            log_entry.update(record.extra_fields)

        # Add exception info if present
        if record.exc_info:
            log_entry['exception'] = {
                'type': record.exc_info[0].__name__,
                'message': str(record.exc_info[1]),
                'traceback': self.formatException(record.exc_info)
            }

        # Add source location for errors
        if record.levelno >= logging.ERROR:
            log_entry['source'] = {
                'file': record.pathname,
                'line': record.lineno,
                'function': record.funcName
            }

        return json.dumps(log_entry, default=str)


class ContextLogger:
    """
    Logger that automatically includes context in all log messages.
    """

    def __init__(self, name: str):
        self.logger = logging.getLogger(name)

    def _log(self, level: int, message: str, **kwargs):
        """Log with extra fields."""
        # logger.log() applies the level check; stacklevel=3 makes the record
        # point at the caller of .info()/.error(), not at this wrapper
        self.logger.log(
            level,
            message,
            extra={'extra_fields': kwargs},
            stacklevel=3,
        )

    def debug(self, message: str, **kwargs):
        self._log(logging.DEBUG, message, **kwargs)

    def info(self, message: str, **kwargs):
        self._log(logging.INFO, message, **kwargs)

    def warning(self, message: str, **kwargs):
        self._log(logging.WARNING, message, **kwargs)

    def error(self, message: str, **kwargs):
        self._log(logging.ERROR, message, **kwargs)

    def critical(self, message: str, **kwargs):
        self._log(logging.CRITICAL, message, **kwargs)


def set_request_context(
    trace_id: str,
    span_id: str = None,
    user_id: str = None,
    tenant_id: str = None,
    request_id: str = None
):
    """Set context for the current request."""
    _request_context.set({
        'trace_id': trace_id,
        'span_id': span_id,
        'user_id': user_id,
        'tenant_id': tenant_id,
        'request_id': request_id
    })


# =============================================================================
# USAGE EXAMPLE
# =============================================================================

def setup_logging(service_name: str, environment: str):
    """Configure structured logging for the application."""
    handler = logging.StreamHandler(sys.stdout)
    handler.setFormatter(StructuredFormatter(service_name, environment))

    root_logger = logging.getLogger()
    root_logger.addHandler(handler)
    root_logger.setLevel(logging.INFO)


# Example usage
logger = ContextLogger(__name__)

async def process_payment(payment_id: str, amount: float):
    """Process a payment with structured logging."""

    logger.info(
        "Processing payment",
        payment_id=payment_id,
        amount=amount,
        currency="USD"
    )

    try:
        result = await payment_gateway.charge(payment_id, amount)

        logger.info(
            "Payment successful",
            payment_id=payment_id,
            transaction_id=result.transaction_id,
            processing_time_ms=result.processing_time
        )

        return result

    except PaymentDeclinedException as e:
        logger.warning(
            "Payment declined",
            payment_id=payment_id,
            decline_reason=e.reason,
            decline_code=e.code
        )
        raise

    except Exception as e:
        logger.error(
            "Payment processing failed",
            payment_id=payment_id,
            error_type=type(e).__name__,
            error_message=str(e)
        )
        raise


# Output example (single line, formatted here for readability):
# {
#   "timestamp": "2024-01-15T10:30:00.000Z",
#   "level": "INFO",
#   "logger": "payment_service",
#   "message": "Processing payment",
#   "service": "payment-api",
#   "environment": "production",
#   "trace_id": "abc-123-def-456",
#   "user_id": "user-789",
#   "tenant_id": "tenant-001",
#   "payment_id": "pay-12345",
#   "amount": 99.99,
#   "currency": "USD"
# }3.2 Log Levels and When to Use Them#
DEBUG
Detailed information for debugging. NOT enabled in production by default.
Use for:
- Variable values during execution
- Entering/exiting functions
- Loop iterations
- Detailed state dumps
Example: "Processing item 3 of 100: product_id=ABC, price=19.99"
INFO
Normal operation events. Enabled in production.
Use for:
- Request received/completed
- Business events (order placed, payment processed)
- Configuration loaded
- Service started/stopped
Example: "Order created: order_id=12345, total=99.99"
WARNING
Something unexpected but handled. System continues to function.
Use for:
- Deprecated API usage
- Retryable errors (retry succeeded)
- Resource usage approaching limits
- Fallback to default behavior
- Expected business exceptions
Example: "Payment declined, will retry: attempt 2 of 3"
ERROR
Something failed. Requires attention. May affect individual requests.
Use for:
- Unhandled exceptions
- Failed operations that can't be retried
- Integration failures
- Data corruption detected
Example: "Payment processing failed after 3 retries: timeout"
CRITICAL
System cannot continue. Immediate attention required.
Use for:
- Database connection pool exhausted
- Out of memory
- Critical configuration missing
- Security breach detected
- Data loss imminent
Example: "Database connection pool exhausted, rejecting requests"
3.3 What to Log and What NOT to Log#
DO LOG
- Request ID / Trace ID (for correlation)
- User ID (for debugging user issues)
- Tenant ID (for multi-tenant debugging)
- Business events (order created, payment processed)
- Errors with context
- Performance metrics (processing time)
- State transitions (order: pending → paid → shipped)
- External API calls (request and response status)
Sensitive data handling — RIGHT
logger.info("User login", user_id=user.id)  # No password, no email (PII)

logger.info("Payment", card_last_four=card_number[-4:])

logger.debug("Request received", content_length=len(request.body))DON'T LOG
- Passwords or credentials (NEVER!)
- Full credit card numbers (log last 4 only:
****1234) - Personal health information
- Full API keys (log prefix only:
sk_live_abc...) - Session tokens
- Personally identifiable information in excess
- Large payloads (log size, not content)
- High-frequency events without sampling
Sensitive data handling — WRONG
logger.info(f"User login: email={email}, password={password}")

logger.info(f"Payment: card={card_number}")

logger.debug(f"Request body: {request.body}") # Could be hugeChapter 4: Distributed Tracing#
4.1 Tracing Concepts#
The problem: a single user request touches many services:
%% title: A single user request touches many services
flowchart TD
  U@{ icon: "sd:user", label: "User" } --> GW@{ icon: "sd:gateway", label: "API Gateway" } --> AU["Auth"]:::service
  AU --> US["Users"]:::service --> UDB@{ icon: "sd:database", label: "Database" }
  AU --> OR["Orders"]:::core --> ODB@{ icon: "sd:database", label: "Database" }
  OR --> PAY["Payments"]:::service --> BANK@{ icon: "sd:bank", label: "Bank API" }
  OR --> NOT["Notifications"]:::service --> EM@{ icon: "sd:mail", label: "Email Provider" }
  class U client
  class GW edge
  class UDB,ODB store
class BANK,EM externalWhen something is slow, WHERE is it slow? When something fails, WHERE did it fail?
A TRACE represents the entire journey of a request. A SPAN represents one step in that journey.
- Trace:
abc-123- Span:
api-gateway— 12ms- Span:
auth-service— 5ms- Span:
token-validation— 2ms
- Span:
order-service— 150ms- Span:
db-query-orders— 8ms - Span:
payment-service— 120ms- Span:
bank-api-call— 100ms ← SLOW!
- Span:
notification-service— 15ms- Span:
email-send— 10ms
- Total — 162ms (the two top-level spans run one after the other: 12 + 150)
Now we can see: bank-api-call took 100ms of our 162ms total. That's where to focus optimization efforts.
Trace abc-123 as a span waterfall: api-gateway 12 ms, then order-service 150 ms, inside which bank-api-call takes 100 ms of the 162 ms total. Service A injects its trace context (traceparent) into the HTTP headers and B extracts it to continue the same trace; without that, B starts a new trace.
4.2 OpenTelemetry Implementation#
# tracing/opentelemetry_setup.py

"""
OpenTelemetry tracing setup and utilities.

OpenTelemetry is the industry standard for tracing.
It provides consistent APIs across languages.
"""

from opentelemetry import trace
from opentelemetry.sdk.resources import Resource
from opentelemetry.sdk.trace import TracerProvider
from opentelemetry.sdk.trace.export import BatchSpanProcessor
from opentelemetry.exporter.otlp.proto.grpc.trace_exporter import OTLPSpanExporter
from opentelemetry.instrumentation.fastapi import FastAPIInstrumentor
from opentelemetry.instrumentation.httpx import HTTPXClientInstrumentor
from opentelemetry.instrumentation.sqlalchemy import SQLAlchemyInstrumentor
from opentelemetry.instrumentation.redis import RedisInstrumentor
from opentelemetry.trace import Status, StatusCode
from opentelemetry.propagate import set_global_textmap
from opentelemetry.propagators.b3 import B3MultiFormat
from contextlib import contextmanager
from typing import Optional, Dict, Any
import asyncio
import functools


def setup_tracing(
    service_name: str,
    otlp_endpoint: str = "localhost:4317",
    environment: str = "development"
):
    """
    Configure OpenTelemetry tracing for the application.
    """
    # Create tracer provider
    provider = TracerProvider(
        resource=Resource.create({
            "service.name": service_name,
            "deployment.environment": environment,
        })
    )

    # Export spans to collector (Jaeger, Zipkin, etc.)
    exporter = OTLPSpanExporter(endpoint=otlp_endpoint, insecure=True)
    provider.add_span_processor(BatchSpanProcessor(exporter))

    # Set as global provider
    trace.set_tracer_provider(provider)

    # Set up context propagation (B3 format for compatibility)
    set_global_textmap(B3MultiFormat())

    # Auto-instrument common libraries
    FastAPIInstrumentor().instrument()
    HTTPXClientInstrumentor().instrument()
    SQLAlchemyInstrumentor().instrument()
    RedisInstrumentor().instrument()

    return trace.get_tracer(service_name)


class Tracing:
    """
    Tracing utilities for manual instrumentation.
    """

    def __init__(self, service_name: str):
        self.tracer = trace.get_tracer(service_name)

    @contextmanager
    def span(
        self,
        name: str,
        attributes: Optional[Dict[str, Any]] = None
    ):
        """
        Create a span within the current trace context.

        Usage:
            with tracing.span("process_payment", {"payment_id": "123"}):
                # ... do work ...
        """
        with self.tracer.start_as_current_span(name) as span:
            if attributes:
                for key, value in attributes.items():
                    span.set_attribute(key, value)

            try:
                yield span
            except Exception as e:
                span.set_status(Status(StatusCode.ERROR, str(e)))
                span.record_exception(e)
                raise

    def traced(
        self,
        name: Optional[str] = None,
        attributes: Optional[Dict[str, Any]] = None
    ):
        """
        Decorator to trace a function.

        Usage:
            @tracing.traced("process_order")
            async def process_order(order_id: str):
                ...
        """
        def decorator(func):
            span_name = name or func.__name__

            @functools.wraps(func)
            async def async_wrapper(*args, **kwargs):
                with self.span(span_name, attributes):
                    return await func(*args, **kwargs)

            @functools.wraps(func)
            def sync_wrapper(*args, **kwargs):
                with self.span(span_name, attributes):
                    return func(*args, **kwargs)

            if asyncio.iscoroutinefunction(func):
                return async_wrapper
            return sync_wrapper

        return decorator

    def add_event(self, name: str, attributes: Dict[str, Any] = None):
        """Add an event to the current span."""
        span = trace.get_current_span()
        span.add_event(name, attributes or {})

    def set_attribute(self, key: str, value: Any):
        """Set an attribute on the current span."""
        span = trace.get_current_span()
        span.set_attribute(key, value)

    def get_trace_id(self) -> Optional[str]:
        """Get the current trace ID."""
        ctx = trace.get_current_span().get_span_context()
        if ctx.is_valid:
            return format(ctx.trace_id, '032x')
        return None


# =============================================================================
# USAGE EXAMPLE
# =============================================================================

tracing = Tracing("payment-service")


@tracing.traced("process_payment")
async def process_payment(payment_id: str, amount: float):
    """Process a payment with full tracing."""

    # Add attributes to span
    tracing.set_attribute("payment.id", payment_id)
    tracing.set_attribute("payment.amount", amount)

    # Validate payment
    with tracing.span("validate_payment"):
        validation_result = await validate_payment(payment_id, amount)
        if not validation_result.valid:
            tracing.add_event("validation_failed", {
                "reason": validation_result.reason
            })
            raise ValidationError(validation_result.reason)

    # Check fraud
    with tracing.span("fraud_check", {"payment_id": payment_id}):
        fraud_score = await fraud_service.check(payment_id)
        tracing.set_attribute("fraud.score", fraud_score)

    # Process with payment gateway
    with tracing.span("payment_gateway_call"):
        tracing.add_event("calling_stripe")
        result = await stripe_client.charge(payment_id, amount)
        tracing.add_event("stripe_response", {
            "transaction_id": result.transaction_id
        })

return resultprocess_payment— total: 250msvalidate_payment— 15msfraud_check— 45mspayment_gateway_call— 190ms- Event:
calling_stripe - Event:
stripe_response {transaction_id: "txn_123"}
4.3 Trace Context Propagation#
# tracing/propagation.py

"""
Trace context propagation across service boundaries.

When Service A calls Service B, how does Service B know
to continue the same trace?

Answer: Propagate trace context in HTTP headers.
"""

from opentelemetry import trace
from opentelemetry.propagate import inject, extract
from typing import Dict
import httpx


class TracedHTTPClient:
    """
    HTTP client that propagates trace context.
    """

    def __init__(self):
        self.client = httpx.AsyncClient()

    async def request(
        self,
        method: str,
        url: str,
        **kwargs
    ) -> httpx.Response:
        """Make request with trace context."""

        # Get current trace context
        headers = kwargs.get('headers', {})

        # Inject trace context into headers
        inject(headers)

        kwargs['headers'] = headers

        # Make request (trace context now in headers)
        return await self.client.request(method, url, **kwargs)

    async def get(self, url: str, **kwargs) -> httpx.Response:
        return await self.request("GET", url, **kwargs)

    async def post(self, url: str, **kwargs) -> httpx.Response:
        return await self.request("POST", url, **kwargs)


# With the default W3C Trace Context propagator, the headers look like:
# {
#   "traceparent": "00-4bf92f3577b34da6a3ce929d0e0e4736-00f067aa0ba902b7-01",
#   "tracestate": "congo=t61rcWkgMzE"
# }
#
# With the B3 propagator that setup_tracing() above installs, they look like:
# {
#   "X-B3-TraceId": "4bf92f3577b34da6a3ce929d0e0e4736",
#   "X-B3-SpanId": "00f067aa0ba902b7",
#   "X-B3-Sampled": "1"
# }


class TracedFastAPIMiddleware:
    """
    Middleware that extracts trace context from incoming requests.
    """

    async def __call__(self, request, call_next):
        # Extract trace context from headers
        context = extract(request.headers)

        # Continue trace or start new one
        tracer = trace.get_tracer(__name__)

        with tracer.start_as_current_span(
            f"{request.method} {request.url.path}",
            context=context,
            kind=trace.SpanKind.SERVER
        ) as span:
            # Add request attributes
            span.set_attribute("http.request.method", request.method)
            span.set_attribute("url.full", str(request.url))
            span.set_attribute("http.route", request.url.path)

            response = await call_next(request)

            # Add response attributes
            span.set_attribute("http.response.status_code", response.status_code)

return responseLogs and distributed tracing
Q1/3 A call to the payment gateway times out, and the automatic retry succeeds on attempt 2. What log level fits?
Answer & explanation
Answer: B
The lesson lists "retryable errors (retry succeeded)" under WARNING: unexpected, but the system kept working. ERROR is for failures that couldn't be retried or recovered, like "payment processing failed after 3 retries".
Q2/3 Service A and Service B are both instrumented, yet each request shows up as two separate traces instead of one. What's the most likely cause?
Answer & explanation
Answer: C
B only continues A's trace if A injects the context (traceparent or B3 headers) and B extracts it; otherwise B starts a fresh trace. Sampling would drop spans rather than split a trace, and batching only changes when spans are exported.
Q3/3 While debugging checkout, a developer wants to log the full request body, which includes the card number. What does the lesson recommend?
Answer & explanation
Answer: A
Full card numbers must never be logged, and large payloads should be logged by size, not content. The log level doesn't make sensitive data safe: the rule is about what you write, not how often it's enabled.
Part II: Implementation#
Chapter 5: Building an Observability Stack#
5.1 The Observability Pipeline#
%% title: Observability data flow
flowchart TD
  subgraph APPL["APPLICATION · Your Code"]
    direction TB
    AM["Metrics:<br/>prometheus_client"]:::core
    AL["Logs:<br/>structlog/logging → JSON"]:::core
    AT["Traces:<br/>opentelemetry-sdk"]:::core
  end
  subgraph COLL["COLLECTION · Collectors/Agents"]
    direction TB
    CP@{ icon: "tech:prometheus", label: "Prometheus<br/>(scrapes /metrics endpoint)" }
    CF@{ icon: "sd:log", label: "Fluentd/Vector/Filebeat<br/>(ships logs)" }
    CO@{ icon: "sd:server", label: "OpenTelemetry Collector<br/>(receives traces)" }
  end
  subgraph STOR["STORAGE"]
    direction TB
    SM@{ icon: "sd:database", label: "Prometheus/Mimir/Thanos<br/>(metrics)" }
    SL@{ icon: "sd:database", label: "Elasticsearch/Loki<br/>(logs)" }
    ST@{ icon: "sd:database", label: "Jaeger/Tempo<br/>(traces)" }
  end
  subgraph VIS["VISUALIZATION · Grafana"]
    direction TB
    VD@{ icon: "sd:dashboard", label: "Dashboards<br/>(metrics)" }
    VE@{ icon: "sd:search", label: "Explore<br/>(logs, traces)" }
    VA@{ icon: "sd:alert", label: "Alerting" }
  end
  APPL --> COLL --> STOR --> VIS
  class CP,CF,CO service
  class SM,SL,ST store
  class VD,VE,VA client
5.2 Instrumenting a FastAPI Application#
# observability/fastapi_setup.py

"""
Complete observability setup for a FastAPI application.
"""

from fastapi import FastAPI, Request, Response
from prometheus_client import Counter, Histogram, Gauge, generate_latest, CONTENT_TYPE_LATEST
from opentelemetry import trace
from opentelemetry.instrumentation.fastapi import FastAPIInstrumentor
import time
import logging
import json
import uuid
from typing import Callable
from contextvars import ContextVar

# =============================================================================
# METRICS SETUP
# =============================================================================

# Request metrics (RED method)
REQUEST_COUNT = Counter(
    'http_requests_total',
    'Total HTTP requests',
    ['method', 'endpoint', 'status']
)

REQUEST_LATENCY = Histogram(
    'http_request_duration_seconds',
    'HTTP request latency',
    ['method', 'endpoint'],
    buckets=[0.005, 0.01, 0.025, 0.05, 0.1, 0.25, 0.5, 1, 2.5, 5, 10]
)

REQUESTS_IN_PROGRESS = Gauge(
    'http_requests_in_progress',
    'HTTP requests currently being processed',
    ['method', 'endpoint']
)

# Business metrics
ORDERS_CREATED = Counter(
    'orders_created_total',
    'Total orders created',
    ['status', 'payment_method']
)

ORDER_VALUE = Histogram(
    'order_value_dollars',
    'Order value in dollars',
    buckets=[10, 25, 50, 100, 250, 500, 1000, 2500, 5000, 10000]
)


# =============================================================================
# LOGGING SETUP
# =============================================================================

_request_id: ContextVar[str] = ContextVar('request_id', default='')
_trace_id: ContextVar[str] = ContextVar('trace_id', default='')


class ObservabilityMiddleware:
    """
    Middleware that instruments requests with metrics, logs, and traces.
    """

    def __init__(self, app: FastAPI):
        self.app = app

    async def __call__(self, scope, receive, send):
        if scope['type'] != 'http':
            await self.app(scope, receive, send)
            return

        request = Request(scope, receive)
        method = request.method
        path = self._get_path_template(request)

        # Generate request ID
        request_id = request.headers.get('X-Request-ID', str(uuid.uuid4()))
        _request_id.set(request_id)

        # Get trace ID from OpenTelemetry
        ctx = trace.get_current_span().get_span_context()
        trace_id = format(ctx.trace_id, '032x') if ctx.is_valid else ''
        _trace_id.set(trace_id)

        # Track in-progress requests
        REQUESTS_IN_PROGRESS.labels(method=method, endpoint=path).inc()

        start_time = time.perf_counter()
        status_code = 500  # Default if exception occurs

        async def send_wrapper(message):
            nonlocal status_code
            if message['type'] == 'http.response.start':
                status_code = message['status']
            await send(message)

        try:
            # Log request
            logging.info(json.dumps({
                'event': 'request_started',
                'method': method,
                'path': str(request.url),
                'request_id': request_id,
                'trace_id': trace_id,
                'user_agent': request.headers.get('User-Agent', ''),
            }))

            await self.app(scope, receive, send_wrapper)

        finally:
            # Calculate duration
            duration = time.perf_counter() - start_time

            # Record metrics
            REQUEST_COUNT.labels(
                method=method,
                endpoint=path,
                status=str(status_code)
            ).inc()

            REQUEST_LATENCY.labels(
                method=method,
                endpoint=path
            ).observe(duration)

            REQUESTS_IN_PROGRESS.labels(method=method, endpoint=path).dec()

            # Log response
            logging.info(json.dumps({
                'event': 'request_completed',
                'method': method,
                'path': path,
                'status_code': status_code,
                'duration_ms': round(duration * 1000, 2),
                'request_id': request_id,
                'trace_id': trace_id,
            }))

    def _get_path_template(self, request: Request) -> str:
        """Get path template for metric labels (avoid high cardinality)."""
        # Use the route path template if available
        if hasattr(request, 'scope') and 'route' in request.scope:
            route = request.scope['route']
            if hasattr(route, 'path'):
                return route.path

        # Fallback: normalize the path
        path = request.url.path

        # Replace UUIDs with placeholder
        import re
        path = re.sub(
            r'[0-9a-f]{8}-[0-9a-f]{4}-[0-9a-f]{4}-[0-9a-f]{4}-[0-9a-f]{12}',
            '{id}',
            path
        )

        # Replace numeric IDs
        path = re.sub(r'/\d+', '/{id}', path)

        return path


def create_app() -> FastAPI:
    """Create FastAPI app with full observability."""
    app = FastAPI()

    # Add observability middleware
    app.add_middleware(ObservabilityMiddleware)

    # Instrument with OpenTelemetry
    FastAPIInstrumentor.instrument_app(app)

    # Metrics endpoint
    @app.get('/metrics')
    async def metrics():
        return Response(
            content=generate_latest(),
            media_type=CONTENT_TYPE_LATEST
        )

    # Health check (traced too, unless excluded: instrument_app(app, excluded_urls="health"))
    @app.get('/health')
    async def health():
        return {'status': 'healthy'}

return appChapter 6: Dashboards and Alerting#
6.1 Dashboard Design Principles#
Principle 1: Layered dashboards
- Layer 1: Executive (high-level)
- Overall availability
- Error budget status
- Key business metrics
- Layer 2: Service (per-service)
- RED metrics for this service
- Dependencies status
- Recent deployments
- Layer 3: Debug (detailed)
- Per-endpoint latency
- Resource utilization
- Linked to logs and traces
Principle 2: The 4 golden signals first
Every service dashboard should show:
- Latency - p50, p90, p99 over time
- Traffic - Requests per second
- Errors - Error rate, by type
- Saturation - Resource utilization
Principle 3: Time comparisons
Show current vs:
- Last hour
- Same time yesterday
- Same time last week
- Baseline (normal behavior)
This makes anomalies obvious.
Principle 4: Link everything
From any metric:
- Click to see related logs
- Click to see traces for that time window
- Click to see deployments
- Click to run relevant queries
Reduce time to root cause.
Design it: an alert worth waking up for
You're writing the one alert that pages on-call at night for the checkout API. What should it measure, how long should the condition last before it fires, and what must the page contain?
One strong answer
- Measure what users feel: the 5xx rate or p99 latency, not CPU. High CPU may be harmless; failing requests never are.
- Require it to hold for a few minutes, so a brief blip doesn't wake anyone.
- Make the page actionable: which service, how bad, and a runbook link that tells on-call what to check first. An alert with no clear action shouldn't page.
6.2 Alert Design#
# alerting/rules.py

"""
Alert rule definitions following best practices.

Good alerts are:
- Actionable: Someone should DO something
- Urgent: It matters NOW
- Clear: The problem is obvious
- Linked: Points to runbook
"""

from dataclasses import dataclass
from typing import List, Optional
from enum import Enum


class Severity(Enum):
    CRITICAL = "critical"  # Page immediately, any time
    WARNING = "warning"    # Page during business hours, or ticket
    INFO = "info"          # Log, review later


@dataclass
class AlertRule:
    name: str
    expression: str
    duration: str  # How long condition must be true
    severity: Severity
    summary: str
    description: str
    runbook_url: str
    labels: dict = None


# =============================================================================
# GOOD ALERT EXAMPLES
# =============================================================================

ALERT_RULES: List[AlertRule] = [

    # SLO-based alert: Error budget burning fast
    AlertRule(
        name="ErrorBudgetBurnRateCritical",
        expression="""
            (
              sum(rate(http_requests_total{status=~"5.."}[1h]))
              /
              sum(rate(http_requests_total[1h]))
            ) > 14.4 * 0.001
            and
            (
              sum(rate(http_requests_total{status=~"5.."}[5m]))
              /
              sum(rate(http_requests_total[5m]))
            ) > 14.4 * 0.001
        """,
        duration="5m",
        severity=Severity.CRITICAL,
        summary="Error budget burning at critical rate",
        description="Error rate is 14.4x the SLO threshold. "
                   "That burns 2% of the 30-day budget per hour (all of it in ~2 days).",
        runbook_url="https://wiki/runbooks/error-budget-burn",
    ),

    # Symptom-based alert: Users experiencing errors
    AlertRule(
        name="HighErrorRate",
        expression="""
            sum(rate(http_requests_total{status=~"5.."}[5m]))
            /
            sum(rate(http_requests_total[5m]))
            > 0.05
        """,
        duration="5m",
        severity=Severity.CRITICAL,
        summary="High error rate: {{ $value | humanizePercentage }}",
        description="More than 5% of requests are failing. "
                   "Users are being impacted.",
        runbook_url="https://wiki/runbooks/high-error-rate",
    ),

    # Latency alert
    AlertRule(
        name="HighLatency",
        expression="""
            histogram_quantile(0.99,
              sum(rate(http_request_duration_seconds_bucket[5m])) by (le)
            ) > 1
        """,
        duration="5m",
        severity=Severity.WARNING,
        summary="p99 latency above 1 second",
        description="99th percentile latency is {{ $value }}s. "
                   "Users may experience slow responses.",
        runbook_url="https://wiki/runbooks/high-latency",
    ),

    # Saturation alert: Resource exhaustion warning
    AlertRule(
        name="DatabaseConnectionPoolNearExhaustion",
        expression="""
            db_connections_active / db_connections_max > 0.8
        """,
        duration="10m",
        severity=Severity.WARNING,
        summary="Database connection pool at {{ $value | humanizePercentage }}",
        description="Connection pool is nearly exhausted. "
                   "Requests may start failing if this continues.",
        runbook_url="https://wiki/runbooks/db-connection-pool",
    ),

    # Dependency alert
    AlertRule(
        name="PaymentProviderErrors",
        expression="""
            sum(rate(external_api_requests_total{
              service="payment-provider",
              status="error"
            }[5m]))
            /
            sum(rate(external_api_requests_total{
              service="payment-provider"
            }[5m]))
            > 0.1
        """,
        duration="5m",
        severity=Severity.CRITICAL,
        summary="Payment provider error rate high",
        description="10%+ of payment provider requests failing. "
                   "Payments may be impacted.",
        runbook_url="https://wiki/runbooks/payment-provider-errors",
    ),
]


# =============================================================================
# BAD ALERT EXAMPLES (DON'T DO THIS)
# =============================================================================

BAD_ALERTS = """

❌ BAD: CPU alert
   expression: cpu_usage > 80

   Why bad:
   - High CPU might be fine if latency is good
   - Not actionable (what do you do?)
   - Doesn't indicate user impact

   Better: Alert on latency or error rate

❌ BAD: Any error alert
   expression: error_count > 0

   Why bad:
   - Some errors are normal
   - Extremely noisy
   - Desensitizes on-call

   Better: Alert on error RATE exceeding threshold

❌ BAD: Missing runbook
   summary: "Something went wrong"
   runbook: (none)

   Why bad:
   - On-call can't help if they don't know what to do
   - Increases mean time to recovery

   Better: Always include runbook link

❌ BAD: Unclear scope
   summary: "Errors detected"

   Why bad:
   - Which service?
   - Which endpoint?
   - How bad?

   Better: "Payment API: 5% error rate affecting checkout"

"""Dashboards and alert design
Q1/3 Which of these alerts should page on-call at 3 AM?
Answer & explanation
Answer: D
Page on symptoms users feel: a sustained error rate is real user impact, and the runbook tells on-call what to do. CPU is a cause that may be harmless, error_count > 0 is pure noise, and the pool alert is a WARNING (business hours or ticket), not a page.
Q2/3 On-call sees p99 at 180ms on the service dashboard but can't tell whether that's normal. Which design principle fixes this most directly?
Answer & explanation
Answer: B
A number only means something against normal behaviour; overlaying the same time yesterday or last week makes anomalies obvious. Linking to logs speeds up diagnosis once you know something is wrong, but doesn't tell you whether it is.
Q3/3 A new service increments its counters, yet Prometheus has no data for it. In the pipeline shown, what should you check first?
Answer & explanation
Answer: A
Prometheus pulls: it scrapes each service's /metrics endpoint, so a missing endpoint or scrape target means no data. Grafana only visualizes what's already stored, and in this pipeline the OTel Collector and Loki handle traces and logs.
6.3 Runbook Template#
# Runbook: High Error Rate

## Alert Details
- **Alert name**: HighErrorRate
- **Severity**: Critical
- **Summary**: HTTP error rate exceeds 5%

## Quick Assessment (< 2 minutes)

1. **Check scope**: Is this one endpoint or all endpoints?
   ```
   Query: sum by (endpoint) (rate(http_requests_total{status=~"5.."}[5m]))
   ```

2. **Check timeline**: When did it start?
   - Look at dashboard for change point
   - Check recent deployments

3. **Check error types**: What's failing?
   ```
   Query: sum by (endpoint, status) (rate(http_requests_total{status=~"5.."}[5m]))
   ```

## Common Causes and Fixes

### Cause 1: Recent deployment broke something
**Symptoms**:
- Errors started at deployment time
- Specific endpoint failing

**Fix**:
```bash
# Rollback to previous version
kubectl rollout undo deployment/api-server
```

### Cause 2: Downstream service is down
**Symptoms**:
- Errors are timeouts or connection refused
- Logs show connection errors to specific service

**Fix**:
1. Check downstream service status
2. If down, check THEIR runbooks
3. Consider enabling fallback/circuit breaker

### Cause 3: Database is overloaded
**Symptoms**:
- Errors are timeouts
- Database CPU/connections high

**Fix**:
1. Check slow query log
2. Kill long-running queries if safe
3. Consider scaling read replicas

## Escalation
- If not resolved in 15 minutes: Page senior on-call
- If customer-reported: Loop in customer support
- If data loss suspected: Page database team

## Post-Incident
- [ ] Incident documented
- [ ] Timeline recorded
- [ ] Root cause identified
- [ ] Follow-up action items createdPart III: Real-World Application#
Chapter 7: Case Studies#
7.1 How Netflix Debugs Issues#
Context
- Hundreds of microservices
- Very high request volume
- Global infrastructure
- Any slowdown = users see buffering
Key tools
- ATLAS (Metrics)
- In-house time series database
- Handles millions of metrics
- Real-time streaming aggregation
- Used for dashboards and alerts
- EDGAR (Troubleshooting)
- Built on sampled distributed traces
- Combines traces, logs and request context in one view
- Used to debug streaming and playback failures
- LUMEN (Dashboards)
- In-house dashboarding platform
- Visualizes Atlas metrics and other data sources
Debug workflow
- Alert fires (Atlas)
- Check which service (Atlas dashboards)
- Find affected traces (Edgar)
- Examine logs and request details for that trace (Edgar)
- Identify root cause
- Fix and verify
Key Insight: They built custom tools because scale demanded it. Most companies should use off-the-shelf tools.
7.2 How Google Does Observability#
A useful way to put it (paraphrase, not a quote from the SRE book):
Observability is about surfacing emergent behavior, not just known failure modes.
Key principles
- STRUCTURED DATA EVERYWHERE
- Structured logs, not free text
- All metrics have consistent labels
- All traces follow consistent format
- CORRELATION BY DEFAULT
- Every request has a trace ID
- Trace ID propagates across all services
- Logs, metrics, traces linked by trace ID
- GOLDEN SIGNALS FOCUS
- Latency
- Traffic
- Errors
- Saturation
- PROGRESSIVE ROLLOUTS + OBSERVABILITY
- Canary deployments
- Automatic rollback if metrics degrade
- Observability enables safe deployments
Tools
- Monarch (metrics) - Handles Google scale
- Dapper (traces) - Its 2010 paper popularised distributed tracing (earlier systems include X-Trace and Magpie)
- Cloud Logging (logs) - Structured log storage
- Cloud Monitoring - Unified dashboards
Lesson: Observability is not optional at scale. It's infrastructure, not an afterthought.
Chapter 8: Common Mistakes#
MISTAKE 1: Too Many Metrics
Wrong:
- 10,000 metric names
- High-cardinality labels (user_id, request_id)
- Everything has a metric
Problems:
- Metrics storage explodes
- Dashboards are overwhelming
- Can't find signal in noise
Right:
- Focused metrics (RED, USE)
- Low-cardinality labels
- If you won't alert or dashboard, don't metric
MISTAKE 2: Logs Without Context
Wrong:
log.error("Payment failed")Problems:
- Which payment?
- Which user?
- What was the error?
- Can't correlate to other events
Right:
log.error("Payment failed", {
  payment_id: "pay-123",
  user_id: "user-456",
  error_code: "insufficient_funds",
  trace_id: "abc-789"
})
MISTAKE 3: No Correlation
Wrong:
- Metrics in Prometheus
- Logs in Elasticsearch
- Traces in Jaeger
- No links between them
Problems:
- Switching between tools is slow
- Context lost during debugging
- Longer time to resolution
Right:
- Include trace_id in all logs
- Link dashboards to logs/traces
- Use exemplars (link metrics to traces)
MISTAKE 4: Alert on Causes, Not Symptoms
Wrong: Alert: "CPU usage > 80%"
Problems:
- CPU can be high while system is healthy
- Doesn't indicate user impact
- Not actionable
Right: Alert: "p99 latency > 500ms"
This is a symptom users experience. CPU is just one possible cause.
MISTAKE 5: No Runbooks
Wrong: Alert: "Database errors detected" — Action: ???
Problems:
- On-call doesn't know what to do
- Different people do different things
- Longer MTTR
Right:
- Every alert has a runbook link.
- Runbook has step-by-step diagnosis.
- Runbook is tested and updated.
Observability in practice
Q1/3 In the Netflix debugging workflow, an alert fires. What comes next, in order?
Answer & explanation
Answer: B
Metrics say something is wrong and where; traces narrow it to the failing requests; logs for those traces explain why. Each tool hands the next one a smaller haystack.
Q2/3 Which four signals does the "golden signals" principle focus on?
Answer & explanation
Answer: B
Latency, traffic, errors and saturation describe any service from its users' side plus how close it is to its limits. Resource metrics like CPU explain causes; the golden signals describe health.
Q3/3 A latency spike shows on a dashboard. What lets you jump from it to the slow requests' traces and their log lines?
Answer & explanation
Answer: B
Correlation is a convention, not a product: the same trace ID everywhere. Without it you are matching timestamps by hand across three tools.
Part IV: Interview Preparation#
Chapter 9: Interview Tips#
9.1 Observability Discussion Framework#
- START WITH DETECTION — "First, we need to know there's a problem. I'd set up alerting based on SLOs — if error rate exceeds budget burn rate, we get paged."
- DESCRIBE THE THREE PILLARS — "For debugging, I rely on three signals:
- Metrics show me WHEN and HOW BAD
- Logs show me WHAT happened
- Traces show me WHERE in the request path"
- WALK THROUGH A DEBUG SESSION — "If I get an alert for high latency:
- Check dashboard - which service is slow?
- Look at traces - where in the call chain?
- Examine logs - what errors are happening?
- Correlate with deployments - did something change?"
- MENTION CORRELATION — "The key is having trace IDs that link everything. I should be able to go from metric → trace → logs for a single request seamlessly."
- TALK ABOUT ACTIONABILITY — "Every alert needs a runbook. When I'm paged at 3am, I need to know exactly what steps to take."
9.2 Key Phrases#
On the Three Pillars
"Metrics tell me WHEN something is wrong and HOW BAD. Logs tell me WHAT happened specifically. Traces tell me WHERE in the system it happened. Together, they answer WHY."
On Correlation
"The first thing I do is find the trace ID. From there, I can see the entire request journey, pull up the logs for each service involved, and correlate with metrics for that time window."
On Alert Design
"I alert on symptoms, not causes. Users don't care if CPU is high — they care if their request is slow. So I alert on latency, not CPU. CPU is something I investigate after the alert."
On Structured Logging
"Every log line includes context: trace_id, user_id, request_id, and relevant business data. Without structure, logs are just text to grep through. With structure, I can query 'show me all errors for user X in the last hour.'"
On Debugging
"My debug workflow is:
- Alert tells me something is wrong
- Dashboard shows me scope and timeline
- Traces show me the slow/failing path
- Logs give me the specific error
- This usually identifies the root cause in under 10 minutes."
Chapter 10: Practice Problems#
Practice · problem 1
Problem 1: Debug a Slow API#
Scenario: Users report the checkout API is slow. How do you investigate?
Questions:
- What metrics would you check first?
- How would you use traces to narrow down the issue?
- What logs would you look for?
Click for approach
-
Metrics first:
- Check p99 latency for /checkout endpoint
- Compare to baseline (yesterday, last week)
- Check error rate (slowness might be from retries)
-
Traces to narrow down:
- Sample traces for slow requests (> 1s)
- Look at span durations to find the slow segment
- Is it database? External API? Computation?
-
Logs for details:
- Search logs for slow trace IDs
- Look for specific errors or warnings
- Check for unusual patterns (large payloads, etc.)
Practice · problem 2
Problem 2: Design Observability for a New Service#
Scenario: You're launching a new notification service. Design the observability.
Questions:
- What metrics would you expose?
- What should be logged?
- How would you set up tracing?
Click for approach
-
Metrics (RED + business):
notifications_sent_total{channel, status}notification_latency_seconds{channel}notification_queue_depthprovider_request_duration_seconds{provider}
-
Logging:
- INFO: Notification sent (notification_id, user_id, channel)
- WARNING: Retry attempted, provider fallback
- ERROR: Send failed, provider error
-
Tracing:
- Trace from API receipt to delivery confirmation
- Spans for: validation, routing, provider call, callback
- Include notification_id as span attribute
Chapter 11: Sample Interview Dialogue#
"You're on call and get paged for high latency. Walk me through how you'd debug it."
"Sure. Let me walk through my process.
First, I acknowledge the alert and check the dashboard:"
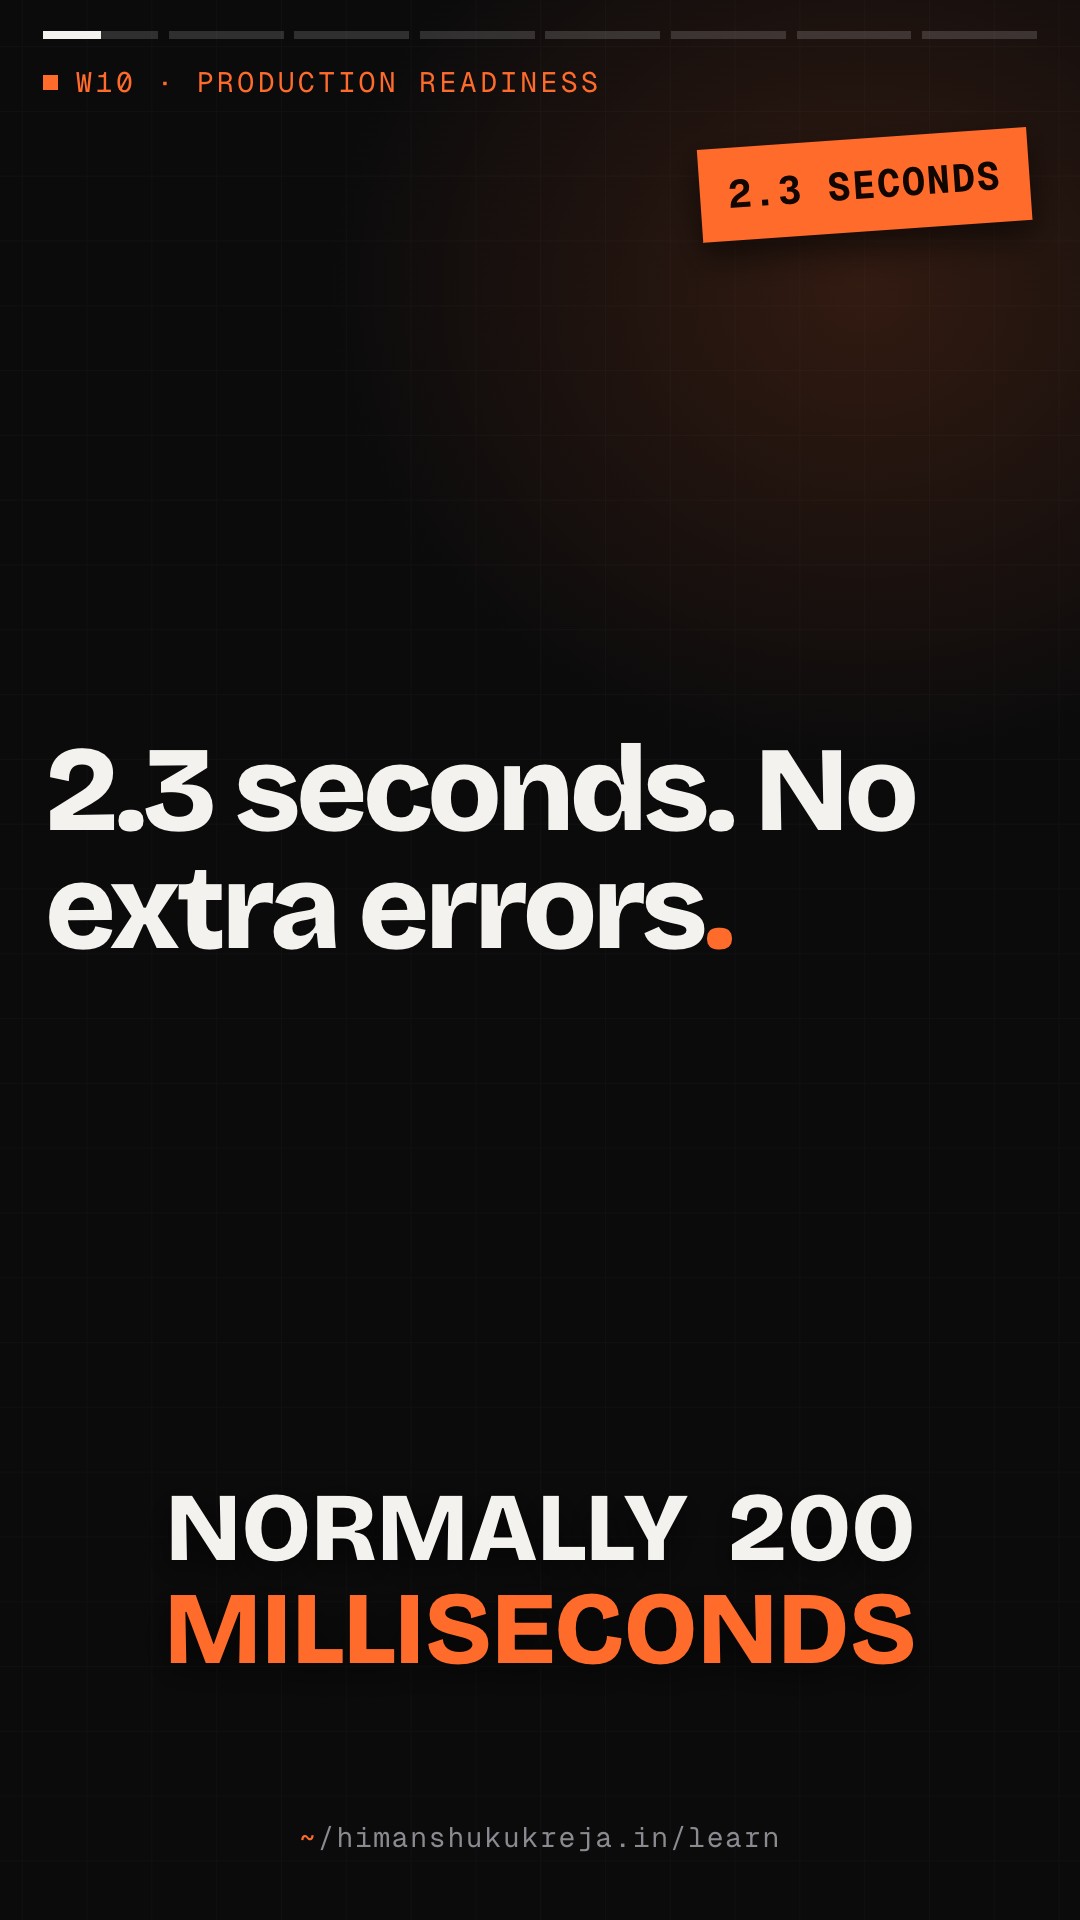
- 2.3s — p99 latency (normally 200ms)
- 10 minutes ago — Started
/api/orders— Affected endpoint- Normal — Error rate (so it's slow, not failing)
"Now I know it's the orders endpoint. Let me look at traces:"
api-gateway— 5ms, okorders-service— 2.2s ← SLOWget-user— 50ms, okget-products— 2s ← HERE'S THE PROBLEMdatabase-query— 2s
calculate-total— 10ms, ok
- Total — 2.2s
"So you found it's the products database query. Now what?"
"I'd check the logs for that trace ID to see the actual query:"
{
  "trace_id": "abc-123",
  "span": "database-query",
  "query": "SELECT * FROM products WHERE id IN (...)",
  "duration_ms": 2000,
  "rows_returned": 500
}
"500 rows is a lot. Let me check if this is a new pattern:"
rows_returnedp99: Was 10, now 500- Change started: Matches latency spike
- Correlates with: New customer onboarded
**"Root cause: A new customer placed an order with 500 products, overwhelming our query. The fix could be pagination or a query optimization.
For immediate mitigation, I might add a query timeout or limit. Long-term, we need to optimize for large orders."**
"Good systematic approach. How would you prevent this in the future?"
"A few things:
- Add an alert for abnormal query row counts
- Add a dashboard panel for p99 rows returned
- Consider adding a limit in the code
- Load test with realistic order sizes
The key is making the unusual case visible before it becomes a problem."
Summary#
The three pillars
- Metrics: WHEN and HOW BAD (aggregated numbers)
- Logs: WHAT happened (detailed events)
- Traces: WHERE in the system (request journey)
- Together: WHY it happened
Metrics best practices
- Use RED method for services (Rate, Errors, Duration)
- Use USE method for resources (Utilization, Saturation, Errors)
- Low-cardinality labels only
- Include units in metric names
Logging best practices
- Structured JSON format
- Include
trace_idfor correlation - Include context (
user_id,request_id) - Don't log sensitive data
Tracing best practices
- Propagate trace context across services
- Name spans meaningfully
- Add relevant attributes
- Sample appropriately at scale
Alerting best practices
- Alert on symptoms, not causes
- Every alert needs a runbook
- Use multi-window burn rate for SLOs
- Severity should be clear and consistent
The debug workflow
- Alert fires → Check dashboard for scope
- Find slow/failing traces
- Examine spans to locate issue
- Check logs for details
- Correlate with changes (deploys, etc.)
- Fix and verify
Further Reading#
Books:
- Book
"Observability Engineering" by Charity Majors, Liz Fong-Jones, George Miranda
- Book
"Distributed Systems Observability" by Cindy Sridharan
Tools:
- Read
Grafana: Dashboards and visualization
- Read
Prometheus: Metrics collection and alerting
- Read
Jaeger/Tempo: Distributed tracing
- Read
Loki: Log aggregation
- Read
OpenTelemetry: Instrumentation standard
Articles:
- Read
Google: "Dapper, a Large-Scale Distributed Systems Tracing Infrastructure"
- Read
Netflix: "Edgar: Solving Mysteries Faster with Observability"
- Blog
Honeycomb Blog: Observability best practices
You're building the complete toolkit of a production engineer. Define health. See health. Now: maintain health through change.
this lesson in shorts · 2
play them all →One idea from this lesson in about a minute each, made for your phone.
Go deeper · reading trail
all reading →Real write-ups from the teams that built these systems. Each opens on the publisher's site in a new tab.
Dapper, a Large-Scale Distributed Systems Tracing Infrastructure
Benjamin H. Sigelman, Luiz André Barroso et al. · 2010- What
- The Google paper that introduced trace trees and spans.
- Key idea
- Propagate a trace ID through every RPC, record spans with low overhead and sample aggressively so tracing can stay on everywhere in production.
- Why here
- The design behind the tracing chapter of this lesson; Zipkin, Jaeger and OpenTelemetry follow its model.
Evolving Distributed Tracing at Uber Engineering
Yuri Shkuro · 2017- What
- The history of tracing at Uber that led to Jaeger.
- Key idea
- Uber went from Merckx, its first tracer built on a Kafka stream, through Zipkin-style instrumentation to Jaeger, and switched from a pull to a push architecture.
- Why here
- What it takes to roll tracing out across hundreds of services, the hard part this lesson's observability stack glosses over.
Logging at Zerodha
Karan Sharma · 2023- What
- Why Zerodha moved its application logs off the ELK stack.
- Key idea
- Elasticsearch struggled with post-2020 volumes and long regulatory retention, so logs now flow through Vector into ClickHouse, with Metabase for queries.
- Why here
- The logs pillar of this lesson with real constraints: volume, cost and retention decide the storage engine.
New lessons by email
New lessons, side quests and case files as they ship, at most once a week. No spam, unsubscribe anytime.
Discussion · …
Public: everyone reading this lesson sees comments. Be kind and keep it on the material.