Week Overview#
"From Raw Events to Actionable Insights"
You've built systems that SERVE data (search, APIs, notifications). Now you'll build systems that UNDERSTAND data.
This week: Design the infrastructure that powers dashboards, business intelligence, ML features, and data-driven decisions.
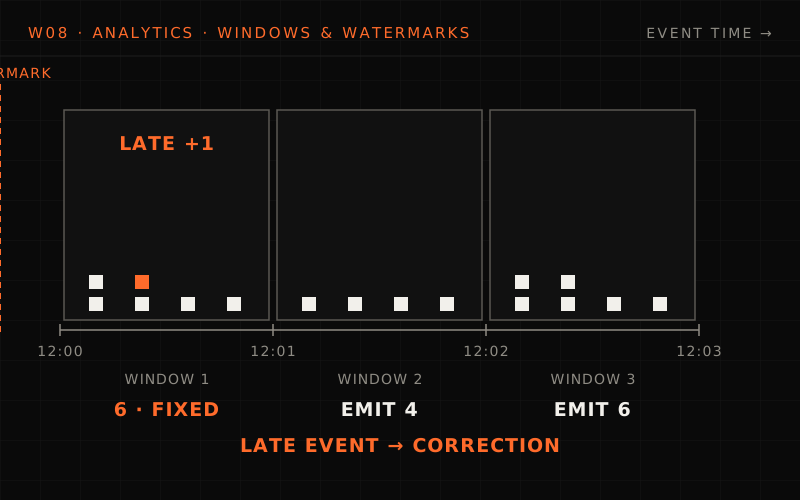
Week 8 builds the pipeline that turns an e-commerce platform's 100M events a day (1,000+ a second) into answers, some needed in real time and some that can wait. Day 1 ingests events into Kafka, Day 2 chooses streaming (Flink), batch (Spark) or both, Day 3 models a star schema, Day 4 handles late data with watermarks and reprocessing, Day 5 builds sub-second dashboard queries, and the capstone covers 10M concurrent viewers on a video platform. Its examples: a mobile event sent 30 minutes late moves a dashboard from 1,000 to 1,050 events, and partitioning, pre-aggregation, columnar storage, materialized views and caching cut a 1B-row query from 60 seconds to 200 ms.
The Problem We're Solving#
Your e-commerce platform generates events
| Event | Volume |
|---|---|
| Page views | 50M/day |
| Clicks | 20M/day |
| Searches | 10M/day |
| Add to cart | 5M/day |
| Purchases | 500K/day |
| User actions | 100M/day total |
Business needs answers
- "What's our conversion rate this hour?"
- "Which products are trending right now?"
- "What's the average order value by region?"
- "Show me a funnel from search → view → cart → purchase"
- "Which marketing campaigns drove revenue yesterday?"
- "What's our real-time revenue for the flash sale?"
The challenge
- Volume: 100M+ events/day
- Velocity: 1,000+ events/second
- Variety: Different event types, schemas evolving
- Latency: Some queries need real-time, others can wait
- Accuracy: Business decisions depend on correct numbers
- Cost: Can't afford to store and query everything naively
This week teaches you to build the pipeline that makes this possible.
The analytics challenge
Q1/2 Your platform produces about 100M user events per day. Roughly what average ingestion rate is that?
Answer & explanation
Answer: C
100M / 86,400 seconds is roughly 1,150 events/second, which is why the challenge lists velocity as 1,000+ events/second. Remember this is an average: peaks (flash sales) can be several times higher, so you size for bursts, not the mean.
Q2/2 The business asks both for "real-time revenue for the flash sale" and "which campaigns drove revenue yesterday". What does that tell you about the pipeline?
Answer & explanation
Answer: A
The challenge explicitly says some queries need real-time while others can wait. That split is what drives the streaming vs batch choice later this week. Forcing everything through real-time is costly and often less accurate; batch-only cannot answer "right now" questions during a flash sale.
What You'll Learn#
Day 1: Event Ingestion at Scale#
Topics
- Event schema design and evolution
- Ingestion patterns (push vs pull)
- Kafka as the event backbone
- Handling ingestion spikes
- Event validation and enrichment
- Exactly-once delivery guarantees
Key question
"How do you reliably capture 100M events/day without losing data or blocking producers?"
System design
Design an event ingestion layer for a ride-sharing app tracking rides, driver locations, payments, and ratings.
Day 2: Streaming vs Batch Processing#
Topics
- Lambda Architecture (batch + streaming)
- Kappa Architecture (streaming only)
- Stream processing with Flink/Spark Streaming
- Batch processing with Spark
- When to use which approach
- Handling state in streaming
Key question
"When do you need real-time dashboards vs when can you wait for hourly batch jobs?"
System design
Build both real-time and batch pipelines for computing metrics like DAU, conversion rate, and revenue.
Day 3: Data Modeling for Analytics#
Topics
- Star schema and snowflake schema
- Fact tables and dimension tables
- Slowly changing dimensions (SCD)
- Pre-aggregation strategies
- Columnar storage (Parquet, ORC)
- Partitioning for query performance
Key question
"How do you model data so a query across 1 billion rows returns in under 5 seconds?"
System design
Design the data warehouse schema for an e-commerce analytics platform.
Day 4: Late-Arriving Data and Correctness#
Topics
- Event time vs processing time
- Watermarks and allowed lateness
- Windowing strategies
- Handling out-of-order events
- Reprocessing and backfill
- Exactly-once semantics in practice
Key question
"What happens when an event from 2 hours ago suddenly arrives? How do you update the dashboard?"
System design
Handle late-arriving mobile app events with offline usage and poor connectivity.
Day 5: Query Layer and Optimization#
Topics
- OLAP databases (ClickHouse, Druid, BigQuery)
- Materialized views and rollups
- Query optimization techniques
- Caching strategies for dashboards
- Cost management (storage vs compute)
- Multi-tenancy in analytics
Key question
"How do you make a dashboard query over 1 year of data return in milliseconds?"
System design
Build the query layer for a multi-tenant SaaS analytics platform.
Day 6: Counting at Scale#
Topics
- Why exact distinct counts cost memory per key, per slice, per day
- Bloom filters for "have we seen this event id?"
- HyperLogLog for unique visitors, and why you never add daily uniques
- Count-Min Sketch for frequencies of heavy hitters
- Top-K with Space-Saving and Misra-Gries, merged across partitions
- Sketch columns in rollups, merged at query time
Key question
"How do you show unique visitors for any date range over 10,000 slices without keeping every visitor id?"
System design
Replace the dashboard's exact unique-visitor, trending and dedupe state with fixed-size sketches.
Capstone: Real-Time Analytics for a Streaming Platform#
Design the analytics infrastructure for a video streaming platform (like Netflix or Hotstar).
Requirements
- Track video starts, pauses, seeks, completions
- Real-time "what's trending now" dashboard
- Historical viewing patterns for recommendations
- Content performance metrics for creators
- A/B test analysis for UI experiments
- Handle 10M concurrent viewers during cricket finals
This capstone integrates
- Event ingestion at massive scale
- Real-time streaming aggregations
- Batch processing for historical analysis
- Data modeling for flexible queries
- Late-arriving data from mobile apps
- Query optimization for dashboards
- Approximate counting for unique viewers and trending titles
Why This Week Matters#
Every modern system needs analytics
| Domain | Analytics |
|---|---|
| E-commerce | Conversion funnels, revenue tracking |
| Social Media | Engagement metrics, content performance |
| FinTech | Transaction monitoring, fraud detection |
| Gaming | Player behavior, monetization |
| SaaS | Usage metrics, churn prediction |
| Streaming | Viewing patterns, recommendations |
As a backend engineer, you'll either
- Build analytics pipelines
- Integrate with analytics systems
- Debug why "the numbers don't match"
- Optimize queries that are too slow
This week gives you the mental models to handle all of these.
Architecture Overview#
%% title: Analytics pipeline architecture
flowchart TD
  subgraph SRC["Data sources"]
    direction TB
    WE@{ icon: "sd:browser", label: "Web Events" }
    MS@{ icon: "sd:phone", label: "Mobile SDK" }
    AL["API Logs"]:::service
    IOT@{ icon: "sd:cpu", label: "IoT Sensors" }
    CDC["DB CDC"]:::store
  end
  subgraph ING["Ingestion layer (Kafka / Kinesis)"]
    direction TB
    RT[["Raw Events Topic"]]:::queue
    VT[["Validated Topic"]]:::queue
    DLQ[["Dead Letter Queue"]]:::queue
  end
  SRC --> ING
  ING --> SP["Streaming Processor<br/>(Flink/KS)"]:::core
  ING --> BP@{ icon: "tech:spark", label: "Batch Processor<br/>(Spark)" }
  ING --> RL@{ icon: "sd:object-storage", label: "Raw Lake (S3/GCS)<br/>Parquet" }
  SP --> RTS@{ icon: "sd:database", label: "Real-time Store<br/>(Druid/ClickHouse)" }
  BP --> WH@{ icon: "sd:database", label: "Warehouse<br/>(Snowflake/BigQuery)" }
  subgraph QL["Query layer"]
    direction TB
    DB@{ icon: "tech:grafana", label: "Dashboards (Grafana)" }
    BI@{ icon: "sd:chart", label: "BI Tools (Tableau)" }
    ML@{ icon: "sd:ml", label: "ML Pipelines (Features)" }
  end
  RTS --> QL
  WH --> QL
  class WE,MS,IOT,DB,BI client
  class BP,ML service
  class RL,WH store
  class RTS cache
Key Concepts We'll Cover#
1. Event Schema Design#
Every event needs
| Field | Purpose |
|---|---|
event_id |
Unique identifier (for deduplication) |
event_type |
What happened |
event_time |
When it happened (client timestamp) |
received_time |
When we received it (server timestamp) |
user_id |
Who did it (if known) |
session_id |
Which session |
device_info |
Platform, version, etc. |
payload |
Event-specific data |
Schema evolution
- Add fields: Safe (default values)
- Remove fields: Dangerous (break consumers)
- Rename fields: Very dangerous
- Solution: Schema registry, versioning
2. Lambda vs Kappa Architecture#
%% title: Lambda architecture
flowchart TD
  RE@{ icon: "sd:queue", label: "Raw Events" }
  RE --> BL@{ icon: "tech:spark", label: "Batch Layer (Spark)" }
  RE --> SL@{ icon: "tech:flink", label: "Speed Layer (Flink)" }
  BL --> BV@{ icon: "sd:database", label: "Batch Views (hourly)" }
  SL --> RV@{ icon: "sd:cache", label: "Real-Time Views" }
  BV --> QL@{ icon: "sd:api", label: "Query Layer" }
  RV --> QL
  class RE queue
  class BL service
  class SL core
  class BV store
  class RV cache
class QL edge- Pros: Accurate batch, fast real-time
- Cons: Two codebases, complexity
%% title: Kappa architecture
flowchart TD
  RE@{ icon: "sd:queue", label: "Raw Events (Immutable)" }
  RE --> SP@{ icon: "tech:flink", label: "Streaming Processor (Flink)" }
  SP --> RV@{ icon: "sd:cache", label: "Real-Time Views" }
  SP --> SV@{ icon: "sd:database", label: "Serving Layer (tables)" }
  class RE queue
  class SP core
  class RV cache
class SV store- Pros: Single codebase, simpler
- Cons: Reprocessing means replaying the log, so it needs long retention
3. Star Schema#
%% title: Star schema for e-commerce
flowchart TD
  FS[("fact_sales<br/>───────────<br/>sale_id · time_id · product_id<br/>customer_id · location_id<br/>quantity · revenue · discount · profit")]:::core
  DP[("dim_product<br/>───────────<br/>product_id · name · category<br/>brand · price")]:::store
  DT[("dim_time<br/>───────────<br/>time_id · date · hour · day_of_week<br/>month · quarter · year · is_weekend")]:::store
  DC[("dim_customer<br/>───────────<br/>customer_id · name · segment<br/>region · signup_date")]:::store
  DL[("dim_location<br/>───────────<br/>location_id · city · state<br/>country · region")]:::store
  FS -->|"product_id"| DP
  FS -->|"time_id"| DT
  FS -->|"customer_id"| DC
FS -->|"location_id"| DL- Fact table: Measures (revenue, quantity)
- Dimension tables: Context (who, what, when, where)
Query: "Revenue by category by month" → JOIN: fact_sales → dim_product → dim_time
4. Handling Late Data#
Expected timeline
- t=0 — Event occurs on mobile app
- t=1s — Event sent to server
- t=2s — Event processed
Reality
- t=0 — Event occurs (user in subway, no signal)
- t=30min — User exits subway, event finally sent
- t=30min+2s — Event processed (30 minutes late!)
The problem
- Dashboard at t=5min showed: 1,000 events
- Dashboard at t=35min shows: 1,050 events
- User asks: "Why did the number change?"
Solutions
- WATERMARKS: "Process events up to X minutes late"
- REPROCESSING: Recompute historical windows
- VERSIONING: Show "as of" timestamp with data
- CORRECTIONS: Separate late data into adjustment tables
5. Query Optimization#
Problem
SELECT date, SUM(revenue)
FROM sales
WHERE date BETWEEN '2024-01-01' AND '2024-12-31'
GROUP BY date
With 1B rows, this takes 60 seconds. Unacceptable for dashboard.
Solutions
- PARTITIONING — Store data partitioned by date. Query only reads relevant partitions. 1B rows → 3M rows for single day
- PRE-AGGREGATION — Maintain daily_revenue table. Updated by streaming/batch job. Query reads 365 pre-computed rows
- COLUMNAR STORAGE — Only read 'date' and 'revenue' columns. Ignore other 50 columns. 90% less I/O
- MATERIALIZED VIEWS — Precompute common queries. Refresh periodically or incrementally
- CACHING — Cache dashboard queries. Invalidate on new data
Result: 60 seconds → 200 milliseconds
Connections to Previous Weeks#
- Week 1 (Data at Scale)
- Partitioning → Partitioned fact tables
- Replication → Read replicas for queries
- Storage patterns → Columnar vs row storage
- Week 2 (Failure-First)
- Idempotency → Exactly-once event processing
- Retries → Handling failed batch jobs
- Circuit breakers → Query timeouts
- Week 3 (Messaging)
- Kafka → Event streaming backbone
- Backpressure → Handling ingestion spikes
- Dead letters → Failed event processing
- Week 4 (Caching)
- Cache strategies → Dashboard query caching
- Invalidation → Cache refresh on new data
- TTL → Time-based cache expiration
- Week 7 (Search)
- Indexing → Pre-aggregated indices
- Query optimization → OLAP query patterns
- Cluster operations → Data warehouse ops
Technologies We'll Discuss#
- Event streaming
- Apache Kafka — industry standard
- AWS Kinesis — managed
- Apache Pulsar — emerging
- Google Pub/Sub — GCP
- Stream processing
- Apache Flink — most powerful
- Kafka Streams — simpler, Kafka-native
- Apache Spark Streaming — batch-oriented
- AWS Kinesis Analytics — managed
- Batch processing
- Apache Spark — industry standard
- Google Dataflow/Beam — unified batch+stream
- dbt — SQL-based transformations
- AWS Glue — managed ETL
- Data warehouses
- Snowflake — cloud-native, popular
- Google BigQuery — serverless, powerful
- Amazon Redshift — AWS native
- Databricks — Spark-based
- ClickHouse — open source, fast
- Real-time OLAP
- Apache Druid — real-time analytics
- ClickHouse — fast queries
- Apache Pinot — LinkedIn-created
- StarRocks — emerging
- Data lake
- Delta Lake — ACID on S3
- Apache Iceberg — table format
- Apache Hudi — streaming to lake
- S3/GCS + Parquet — basic
Week 8 Daily Schedule#
| Day | Theme | Key Deliverable |
|---|---|---|
| Day 1 | Event Ingestion | Reliable event capture at 100K/sec |
| Day 2 | Stream vs Batch | Lambda/Kappa architecture decision |
| Day 3 | Data Modeling | Star schema for e-commerce analytics |
| Day 4 | Late Data | Watermarks and reprocessing strategy |
| Day 5 | Query Layer | Sub-second dashboard queries |
| Day 6 | Counting at Scale | Unique visitors and trending in fixed memory |
| Capstone | Streaming Analytics | Complete analytics for video platform |
Success Criteria#
By the end of Week 8, you should be able to:
- Design event schemas that evolve safely
- Choose between Lambda and Kappa architectures
- Build data models optimized for analytical queries
- Handle late-arriving data without breaking dashboards
- Optimize queries over billions of rows
- Count distinct users and top items in fixed memory, with a known error
- Estimate storage and compute costs for analytics
- Explain trade-offs between real-time and batch accuracy
- Design multi-tenant analytics platforms
- Debug "the numbers don't match" problems
- Interview confidently on analytics system design
Getting Ready#
Concepts to refresh
- Kafka basics (topics, partitions, consumer groups)
- SQL aggregations (GROUP BY, window functions)
- Distributed computing basics (map-reduce mental model)
- Cloud storage (S3, object storage patterns)
Mental models to have
- Write path vs Read path optimization
- Storage vs Compute trade-offs
- Consistency vs Latency trade-offs
- Accuracy vs Speed trade-offs
Questions to ponder
- "Why can't I just use PostgreSQL for analytics?"
- "Why do companies have separate OLTP and OLAP systems?"
- "How does Google Analytics work at scale?"
- "Why are data warehouses so expensive?"
Let's Begin!#
Week 8 Preview Complete
Next: Day 1 — Event Ingestion at Scale
this lesson in shorts · 1
play them all →One idea from this lesson in about a minute each, made for your phone.
New lessons by email
New lessons, side quests and case files as they ship, at most once a week. No spam, unsubscribe anytime.
Discussion · …
Public: everyone reading this lesson sees comments. Be kind and keep it on the material.