Preface#
We've built an impressive analytics pipeline this week. Events flow through Kafka, get processed by Flink and Spark, land in a beautifully designed star schema, and late data is handled gracefully.
There's just one problem:
Marketing team runs a dashboard query: "Show revenue by product category, by region, by day for the last 90 days"
What happens
- Query scans 2.7 billion rows
- Shuffles 50GB of data across cluster
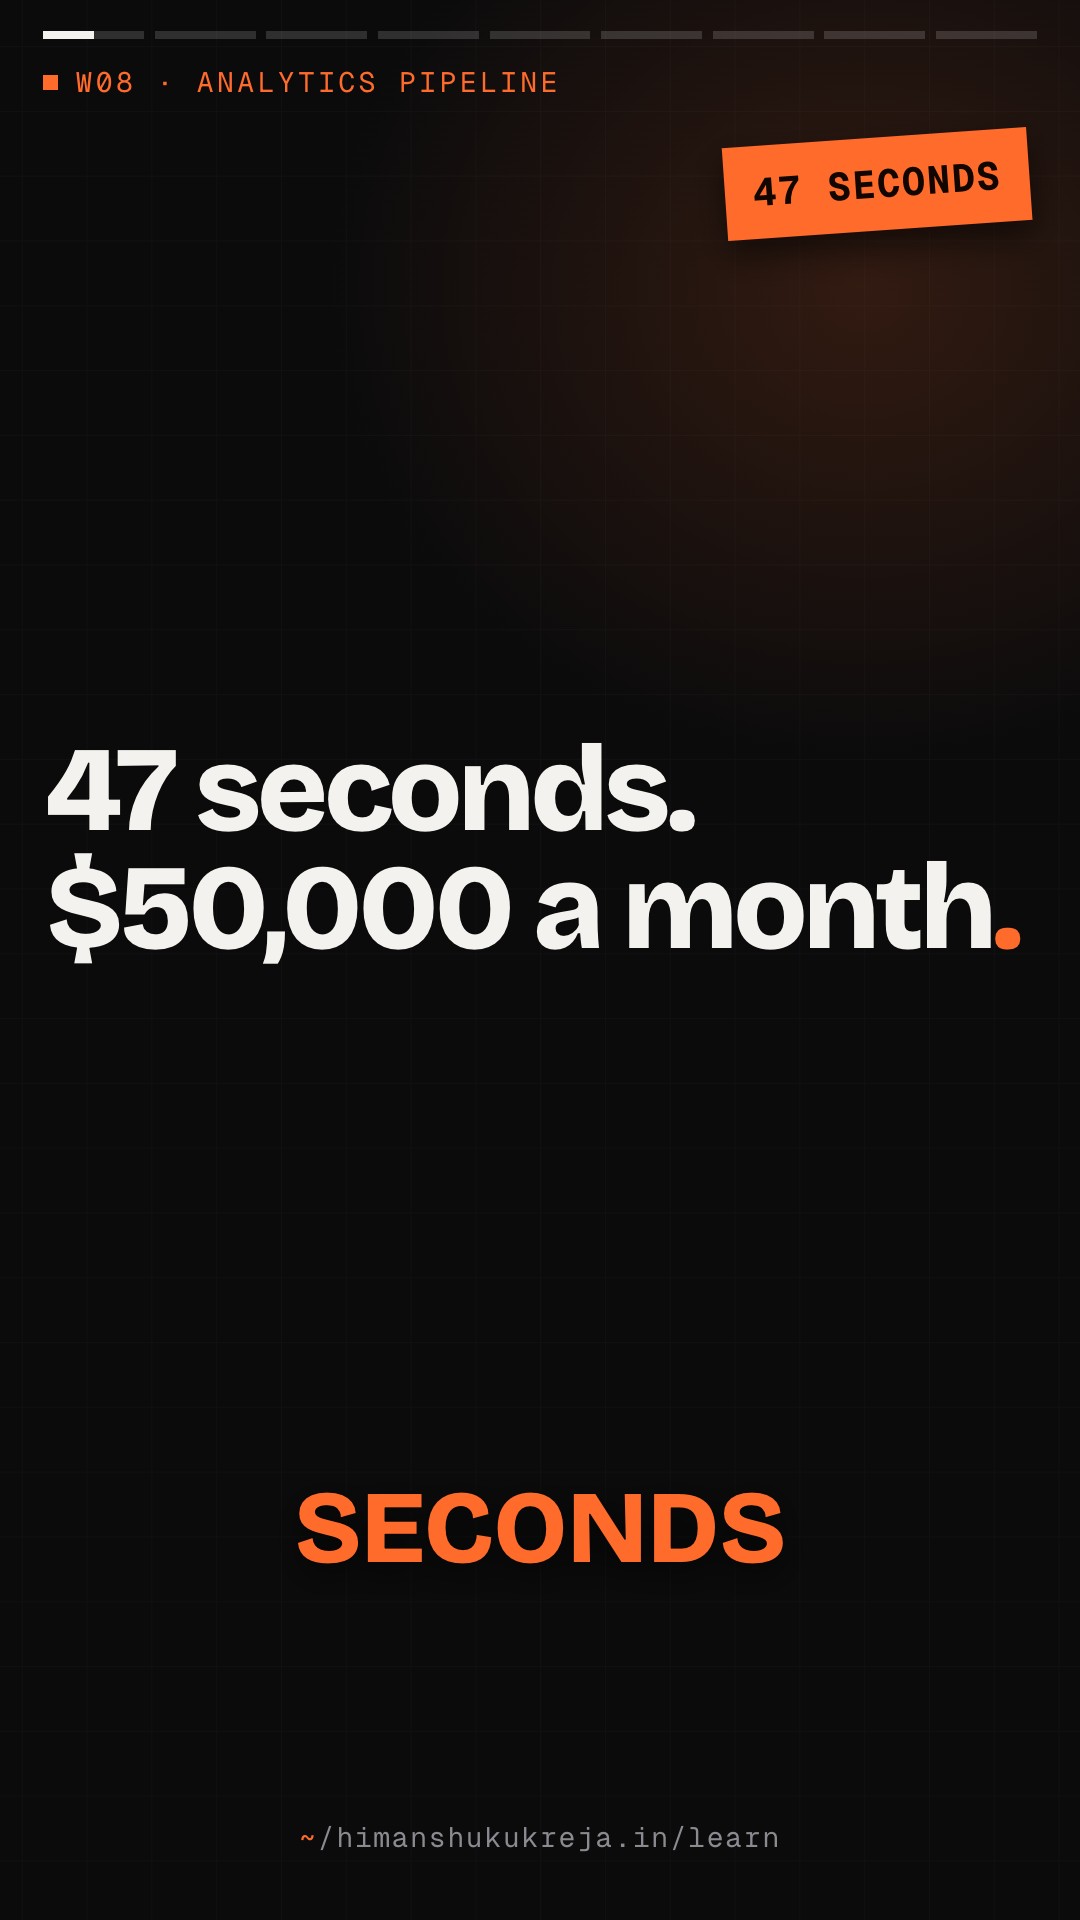
- Takes 47 seconds to return
- Dashboard times out
Users complain
- "The dashboard is unusable"
- "I can't get answers to simple questions"
- "We're paying $50K/month and it's still slow"
- "Can we just use Excel?"
The pipeline is working perfectly. The query layer is broken.
Today, we'll learn to make queries over billions of rows return in milliseconds — without breaking the bank.
A marketing dashboard asks for 90 days of revenue by category, region and day, and the query scans 2.7B of fact_sales' ~11B rows, shuffles 50GB and takes 47 seconds: the pipeline works, the query layer is broken. The fixes: pick the engine by access pattern (a warehouse for 10 daily users, ClickHouse or Druid for 10K real-time users), read less with date partitions (January reads 31 and skips 334), clustering and only the needed columns, and compute once with hourly, daily and monthly rollups (45 seconds becomes 50ms) and result caches whose TTL matches freshness. For many tenants: a tenant_id filter or a schema or database per tenant, per-tenant quotas (10 concurrent queries, 100GB a day, 300-second timeout), and measure first, since the top 10 queries were 70% of time and cost.
Part I: Foundations#
Chapter 1: OLAP Database Landscape#
1.1 Categories of OLAP Systems#
1. Cloud data warehouses
Snowflake · Google BigQuery · Amazon Redshift · Azure Synapse · Databricks SQL
Characteristics:
- Managed, serverless (mostly)
- Separation of storage and compute
- Pay per query or compute time
- Best for: Ad-hoc analytics, SQL users
2. Real-time OLAP databases
Apache Druid · ClickHouse · Apache Pinot · StarRocks · Apache Doris
Characteristics:
- Sub-second queries on fresh data
- Columnar storage with indexing
- Designed for high concurrency
- Best for: Real-time dashboards, user-facing analytics
3. Data lake query engines
Trino (Presto) · Apache Spark SQL · Dremio · Starburst
Characteristics:
- Query data in place (S3, HDFS)
- Schema-on-read flexibility
- Federated queries across sources
- Best for: Data exploration, cross-system queries
4. Embedded analytics
DuckDB · SQLite (with extensions) · Apache DataFusion
Characteristics:
- Runs in-process
- No server to manage
- Great for local analytics
- Best for: Edge computing, embedded BI
Same engine for both?
Two workloads: an executive dashboard for 10 users with a daily refresh, and customer-facing analytics for 10K users who expect real-time numbers. Would you serve both from the same engine?
One strong answer
- Executive dashboard: a cloud warehouse such as Snowflake or BigQuery. Answers in seconds are fine for 10 users, and it's managed and simple.
- Customer-facing: a real-time OLAP store such as ClickHouse or Druid, built for millisecond answers on fresh data at high concurrency.
- Why not one: a warehouse at 10K live users is slow and its cost grows with query volume. A real-time OLAP cluster for 10 daily users is complexity you don't need.
1.2 Choosing the Right Database#
| Latency | Concurrency | Freshness | Cost | Complexity | |
|---|---|---|---|---|---|
| Snowflake | Seconds | Medium | Near-RT | High | Low |
| BigQuery | Seconds | Medium | Streaming | Medium | Low |
| ClickHouse | Millis | High | Real-time | Medium | Medium |
| Druid | Millis | Very High | Real-time | Medium | High |
| Trino | Seconds | Medium | On-demand | Low | Medium |
| DuckDB | Millis | Single | Batch | Free | Very Low |
Use case mapping
| Use case | Choice |
|---|---|
| "Executive dashboard, 10 users, daily refresh" | Snowflake or BigQuery (simple, managed) |
| "Customer-facing analytics, 10K users, real-time" | ClickHouse or Druid (low latency, high concurrency) |
| "Ad-hoc exploration across data lake" | Trino (flexible, federated) |
| "Embedded analytics in application" | DuckDB (in-process, no infra) |
| "Real-time metrics for operations" | Druid or Pinot (sub-second, streaming ingestion) |
1.3 Architecture Patterns#
%% title: Pattern 1 · single warehouse
flowchart LR
  SRC@{ icon: "sd:server", label: "Sources" } --> SF@{ icon: "sd:database", label: "Snowflake" }
  SF --> DB@{ icon: "sd:dashboard", label: "Dashboards" }
  class SRC service
  class SF store
  class DB client
Simple, works for most companies. Limitation: cost scales with query volume.
%% title: Pattern 2 · lake + warehouse
flowchart TD
  SRC@{ icon: "sd:server", label: "Sources" } --> DL@{ icon: "tech:s3", label: "Data Lake (S3)" }
  DL --> WH@{ icon: "sd:database", label: "Warehouse (Snowflake)" }
  WH --> DB@{ icon: "sd:dashboard", label: "Dashboards" }
  DL --> TR["Trino"]:::core
  TR --> AH@{ icon: "sd:terminal", label: "Ad-hoc queries" }
  class SRC service
  class DL,WH store
  class DB,AH client
Lake for cheap storage, warehouse for performance.
%% title: Pattern 3 · lambda query layer
flowchart TD
  RT@{ icon: "tech:kafka", label: "Real-time (Kafka)" } --> CH@{ icon: "tech:clickhouse", label: "ClickHouse" }
  CH --> RTD@{ icon: "sd:dashboard", label: "Real-time dashboards" }
  RT --> BT@{ icon: "tech:s3", label: "Batch (S3)" }
  BT --> BQ@{ icon: "tech:bigquery", label: "BigQuery" }
  BQ --> HA@{ icon: "sd:chart", label: "Historical analysis" }
  class RT queue
  class CH,BT,BQ store
  class RTD,HA client
Different engines for different latency needs.
%% title: Pattern 4 · semantic layer
flowchart TD
  SRC@{ icon: "sd:server", label: "Sources" } --> SL["Semantic Layer<br/>(dbt, Cube.js, AtScale)<br/>Metrics definitions, caching"]:::core
  SL --> DW@{ icon: "sd:database", label: "DW" }
  SL --> OLAP@{ icon: "sd:database", label: "OLAP" }
  class SRC service
  class DW,OLAP store
Consistent metrics across query engines.
Chapter 2: Query Optimization Fundamentals#
2.1 Why Queries Are Slow#
SELECT category, region, SUM(revenue)
FROM fact_sales f
JOIN dim_product p ON f.product_key = p.product_key
JOIN dim_store s ON f.store_key = s.store_key
WHERE f.date_key BETWEEN 20240101 AND 20240331
GROUP BY category, region
What makes it slow
- DATA VOLUME
- ~11B rows in fact_sales (≈30M rows/day). This is a larger retailer than Day 3's example of 1B rows over three years
- Even with the date filter: ~2.7B rows for Q1 (about 90 days)
- Raw scan: 50GB+ of data
- JOINS
- fact_sales → dim_product (1M products)
- fact_sales → dim_store (10K stores)
- Each join requires shuffle/broadcast
- AGGREGATION
- GROUP BY creates many groups
- Partial aggregates on each node
- Final merge on coordinator
- NO OPTIMIZATION
- No partitioning → full scan
- No pre-aggregation → compute from scratch
- No indexes → linear scan
- No caching → repeat work every query
2.2 Optimization Techniques Overview#
- Reduce data scanned
- Partitioning — skip irrelevant files
- Clustering/Sorting — data locality
- Column pruning — read only needed columns
- Predicate pushdown — filter early
- Bloom filters — skip blocks without matches
- Reduce computation
- Pre-aggregation — rollup tables
- Materialized views — precomputed results
- Approximate algorithms — HyperLogLog, sketches
- Sampling — analyze subset
- Reduce latency
- Caching — query results, metadata
- Concurrency — parallel execution
- Vectorization — SIMD operations
- Pipelining — stream results
- Reduce cost
- Compression — smaller storage/transfer
- Tiered storage — hot/warm/cold
- Query scheduling — off-peak
- Result caching — don't recompute
Chapter 3: Partitioning and Clustering#
Two tables, two partition schemes
Dashboards read sales for the last 7 days. A support tool looks up one user's events by user_id in a table with no natural time filter. How would you partition each table, and what is the trap with stacking several partition levels?
One strong answer
- Sales: daily partitions by date, so "last 7 days" reads 7 partitions and skips the rest.
- User events: hash partitions on
user_id(256 buckets, say), so a lookup reads the one bucket the user hashes to. - The trap: year × month × region (or more levels) multiplies into many small partitions. Aim for roughly 100 MB to 1 GB each.
3.1 Partitioning Strategies#
Time-based partitioning (most common)
Daily partitions:
fact_sales/date=2024-01-01/date=2024-01-02/date=2024-01-03/- …
Query: WHERE date BETWEEN '2024-01-01' AND '2024-01-31' — Effect: Read 31 partitions, skip the other 335 (2024 is a leap year with 366 days)
Choosing granularity:
- Daily: Best for recent data queries
- Monthly: Best for historical analysis
- Yearly: Best for archival data
- Hourly: Best for real-time systems (if needed)
Rule of thumb: 100MB - 1GB per partition
Hash partitioning
Distribute by hash of column (e.g., user_id):
fact_user_events/user_hash=0/user_hash=1/- …
user_hash=255/
Query: WHERE user_id = 'user_123' — Effect: Read 1 partition (where hash(user_123) lands)
Use when:
- Point lookups are common
- Need even distribution
- No natural time dimension
Composite partitioning
Multiple partition levels:
fact_sales/year=2024/month=01/region=US/region=EU/region=APAC/
month=02/
year=2023/
Query: WHERE year = 2024 AND month = 1 AND region = 'US' — Effect: Read single leaf partition
Warning: Can lead to too many small partitions!
# query_optimization/partitioning.py

"""
Partitioning strategies for OLAP tables.

Partitioning divides data into manageable chunks that can be
queried independently. Good partitioning = orders of magnitude
faster queries.
"""

from dataclasses import dataclass
from typing import List, Optional
from datetime import date, timedelta
import zlib


@dataclass
class PartitionConfig:
    """Configuration for table partitioning."""
    column: str
    type: str  # "range", "hash", "list"
    granularity: Optional[str] = None  # For time: "day", "month", "year"


class PartitionPruner:
    """
    Determines which partitions to read for a query.
    """

    def __init__(self, partition_config: PartitionConfig):
        self.config = partition_config

    def get_partitions_for_query(
        self,
        filters: dict,
        all_partitions: List[str]
    ) -> List[str]:
        """
        Return only partitions needed for query filters.
        """

        if self.config.column not in filters:
            # No filter on partition column - read all
            return all_partitions

        filter_value = filters[self.config.column]

        if self.config.type == "range":
            return self._prune_range(filter_value, all_partitions)
        elif self.config.type == "list":
            return self._prune_list(filter_value, all_partitions)
        elif self.config.type == "hash":
            return self._prune_hash(filter_value, all_partitions)

        return all_partitions

    def _prune_range(self, filter_value, partitions: List[str]) -> List[str]:
        """Prune partitions for range filter."""

        # filter_value is tuple (start, end)
        start, end = filter_value

        matching = []
        for p in partitions:
            partition_value = self._extract_partition_value(p)
            if start <= partition_value <= end:
                matching.append(p)

        return matching

    def _prune_list(self, filter_value, partitions: List[str]) -> List[str]:
        """Prune partitions for IN list filter."""

        # filter_value is list of values
        matching = []
        for p in partitions:
            partition_value = self._extract_partition_value(p)
            if partition_value in filter_value:
                matching.append(p)

        return matching

    def _prune_hash(self, filter_value, partitions: List[str]) -> List[str]:
        """Prune partitions for hash-partitioned table."""

        # Calculate which partition the value hashes to.
        # Use a stable hash: Python's built-in hash() of a str is randomised
        # per process, so it would not match the buckets written at load time.
        hash_bucket = zlib.crc32(str(filter_value).encode()) % len(partitions)
        return [partitions[hash_bucket]]

    def _extract_partition_value(self, partition_path: str):
        """Extract partition value from path."""
        # e.g., "date=2024-01-15" -> "2024-01-15"
        return partition_path.split("=")[1]


def estimate_partition_savings(
    total_partitions: int,
    partitions_scanned: int,
    avg_partition_size_gb: float
) -> dict:
    """Estimate savings from partition pruning."""

    full_scan_gb = total_partitions * avg_partition_size_gb
    actual_scan_gb = partitions_scanned * avg_partition_size_gb

    return {
        "full_scan_gb": full_scan_gb,
        "actual_scan_gb": actual_scan_gb,
        "savings_gb": full_scan_gb - actual_scan_gb,
        "savings_pct": (1 - partitions_scanned / total_partitions) * 100,
        "partitions_skipped": total_partitions - partitions_scanned
}3.2 Clustering and Sorting#
Without clustering
- File 1:
[A, C, B, A, D, C, B, A, C, D] - File 2:
[B, A, D, C, A, B, C, D, A, B]
Query: WHERE category = 'A' → Must read ALL files (A is scattered everywhere)
With clustering on category
- File 1:
[A, A, A, A, A, B, B, B, B, B] - File 2:
[C, C, C, C, D, D, D, D, D, D]
Query: WHERE category = 'A' → Read only File 1 (A is grouped together)
- Without Z-ordering: Sorted by date only. Query on date + product: Good on date, scattered on product
- With Z-ordering on (date, product): Data interleaved by both columns using Z-curve. Query on date + product: Good locality for both
Visualization of Z-curve (Morton order: interleave the bits):
| product ↓ · date → | 1 | 2 | 3 | 4 |
|---|---|---|---|---|
| 4 | 10 | 11 | 14 | 15 |
| 3 | 8 | 9 | 12 | 13 |
| 2 | 2 | 3 | 6 | 7 |
| 1 | 0 | 1 | 4 | 5 |
Z-order visits: 0,1,2,3,4,5,6,7,8,9,10,11,12,13,14,15
Query: date IN (1,2) AND product IN (1,2) → Values 0,1,2,3 are close together!
# query_optimization/clustering.py

"""
Clustering (sorting) within partitions for better query performance.

Partitioning decides WHICH files to read.
Clustering decides HOW data is organized WITHIN files.
"""

from typing import List


class ClusteringConfig:
    """Configure clustering for a table."""

    def __init__(
        self,
        columns: List[str],
        method: str = "sort",  # "sort", "zorder", "hilbert"
        auto_cluster: bool = True
    ):
        self.columns = columns
        self.method = method
        self.auto_cluster = auto_cluster


# BigQuery clustering example
BIGQUERY_CLUSTERING = """
-- Create clustered table in BigQuery
CREATE TABLE project.dataset.fact_sales
PARTITION BY DATE(order_timestamp)
CLUSTER BY customer_region, product_category  -- filter column first
AS SELECT * FROM source_table;

-- Query benefits from both partition AND cluster pruning
SELECT product_category, SUM(revenue)
FROM project.dataset.fact_sales
WHERE DATE(order_timestamp) = '2024-01-15'  -- Partition pruning
  AND customer_region = 'US-WEST'            -- Cluster pruning
GROUP BY product_category;
"""


# Delta Lake Z-ordering example
DELTA_ZORDER = """
-- Optimize Delta table with Z-ordering
OPTIMIZE fact_sales
ZORDER BY (product_id, customer_id);

-- This helps queries that filter on either or both columns
SELECT * FROM fact_sales
WHERE product_id = 'P123'
  AND customer_id = 'C456';
"""


# ClickHouse ordering
CLICKHOUSE_ORDER = """
-- ClickHouse uses ORDER BY for clustering
CREATE TABLE fact_sales (
    date Date,
    category String,
    region String,
    revenue Float64
)
ENGINE = MergeTree()
PARTITION BY toYYYYMM(date)
ORDER BY (category, region, date);  -- Data sorted by these columns

-- Queries on category, region are very fast
SELECT category, SUM(revenue)
FROM fact_sales
WHERE category = 'Electronics'
GROUP BY category;
"""OLAP choices, partitioning and clustering
Q1/3 You are building customer-facing analytics for 10K users who expect real-time numbers. Which category of engine fits best?
Answer & explanation
Answer: B
Real-time OLAP stores give millisecond latency, high concurrency and real-time freshness, which is exactly this access pattern. Warehouses are simpler but answer in seconds with medium concurrency, so they suit a 10-user executive dashboard rather than 10K live users.
Q2/3
fact_salesis partitioned by day. Someone runsSELECT ... WHERE product_id = 'P123'with no date filter. What does partition pruning do?Answer & explanation
Answer: C
Pruning only works on the partition column. With no date predicate the pruner has to return all partitions, which is the full-table-scan cost trap. Hash-style "read one partition" only applies when the table is hash-partitioned on the filtered column.
Q3/3 Your table is partitioned by date, but queries like
WHERE date = X AND category = 'A'still read every file inside that day's partition. What is the targeted fix?Answer & explanation
Answer: D
Partitioning decides which files to read; clustering decides how rows are laid out inside them. Grouping category 'A' together lets the engine skip files that don't contain it. Smaller hourly partitions still have category scattered in every file, and they risk the too-many-small-partitions problem.
Chapter 4: Pre-Aggregation and Materialized Views#
4.1 When to Pre-Aggregate#
%% title: Pre-aggregation decision framework
flowchart TD
  Q1{"Is the query pattern<br/>predictable?"}:::core
  Q1 -->|"YES"| Q2{"Is it queried<br/>frequently?"}:::core
  Q1 -->|"NO"| COL["Use columnar<br/>storage + indexes"]:::store
  Q2 -->|"YES (>10/day)"| PRE["PRE-AGGREGATE<br/>(Rollup table or<br/>materialized view)"]:::hot
Q2 -->|"NO (<10/day)"| OD["On-demand compute<br/>is probably fine"]:::serviceDaily revenue by category (executive dashboard)
- Queried: 100+ times/day by 20 executives
- Pattern: Always last 30/90/365 days
- Decision: PRE-AGGREGATE (daily rollup table)
- Result: 50ms instead of 45 seconds
Revenue by product by hour by region (ad-hoc exploration)
- Queried: 2-3 times/month by analyst
- Pattern: Different dimensions each time
- Decision: DON'T pre-aggregate
- Result: 45 seconds is acceptable for rare ad-hoc
Size the rollup hierarchy
A year of sales has 1,000 category × region combinations. How many rows are in an hourly rollup, a daily one and a monthly one? A dashboard asks for "last 90 days by day": which table should it read, and how many rows?
One strong answer
- Hourly: 365 × 24 × 1,000 = 8.76 million rows.
- Daily: 365 × 1,000 = 365,000 rows.
- Monthly: 12 × 1,000 = 12,000 rows.
- Route to daily: the coarsest table that still has day-level detail. It reads 90 × 1,000 = 90,000 rows; hourly would read 24× more, and monthly can't split by day.
4.2 Rollup Tables#
Create multiple rollups at different granularities:
| Level | Table | Size | Columns |
|---|---|---|---|
| Level 0: Raw facts (grain: transaction) | fact_sales |
~11B rows, 2TB | |
| Level 1: Hourly rollup | agg_hourly_sales |
8.76M rows (365 days × 24 hours × 1,000 combos) | hour, category, region, SUM(revenue), COUNT(orders) |
| Level 2: Daily rollup | agg_daily_sales |
365K rows (365 days × 1000 combos) | date, category, region, SUM(revenue), COUNT(orders) |
| Level 3: Monthly rollup | agg_monthly_sales |
12K rows (12 months × 1000 combos) | month, category, region, SUM(revenue), COUNT(orders) |
Query routing
- "Last 24 hours by hour" → Level 1 (hourly)
- "Last 90 days by day" → Level 2 (daily)
- "Last 2 years by month" → Level 3 (monthly)
- "Drill into specific transactions" → Level 0 (raw)
A 90-day dashboard query scans ~2.7B of fact_sales' ~11B rows, shuffles 50GB and takes 47 seconds. The daily rollup (365K rows a year) answers it from about 90K rows in milliseconds. Each question routes to the coarsest rollup that can answer it: hourly, daily, monthly, or raw facts for single transactions.
Pre-compute all dimension combinations:
SELECT
    COALESCE(category, 'ALL') as category,
    COALESCE(region, 'ALL') as region,
    COALESCE(channel, 'ALL') as channel,
    SUM(revenue) as revenue,
    COUNT(*) as orders
FROM fact_sales
WHERE date = '2024-01-15'
GROUP BY CUBE(category, region, channel);
This creates rows for:
- (Electronics, US, Web) - specific
- (Electronics, US, ALL) - channel total
- (Electronics, ALL, ALL) - category total
- (ALL, ALL, ALL) - grand total
- ... 8 grouping sets in all (2^3: each dimension kept or rolled up)
(In production use GROUPING() rather than COALESCE, so a real NULL isn't confused with the 'ALL' subtotal)
Query "revenue by category" → filter WHERE region='ALL' AND channel='ALL'. Instant response from pre-computed row!
# query_optimization/rollups.py

"""
Rollup table implementation for pre-aggregation.

Rollups trade storage for query speed.
"""

from dataclasses import dataclass
from typing import List, Dict, Any, Optional
from datetime import date


@dataclass
class RollupDefinition:
    """Defines a rollup table."""
    name: str
    source_table: str
    dimensions: List[str]  # GROUP BY columns
    measures: Dict[str, str]  # column -> aggregation
    refresh_schedule: str
    retention_days: int = 365


class RollupManager:
    """
    Manages rollup table creation and refresh.
    """

    def __init__(self, db_connection):
        self.db = db_connection
        self.rollups: Dict[str, RollupDefinition] = {}

    def create_rollup(self, rollup: RollupDefinition):
        """Create a new rollup table."""

        # Build CREATE TABLE statement
        dimension_cols = ", ".join(rollup.dimensions)
        measure_cols = ", ".join([
            f"{agg}({col}) as {col}_{agg.lower()}"
            for col, agg in rollup.measures.items()
        ])

        sql = f"""
        CREATE TABLE {rollup.name} AS
        SELECT
            {dimension_cols},
            {measure_cols},
            CURRENT_TIMESTAMP as refreshed_at
        FROM {rollup.source_table}
        GROUP BY {dimension_cols}
        """

        self.db.execute(sql)
        self.rollups[rollup.name] = rollup

    def refresh_rollup(
        self,
        rollup_name: str,
        incremental: bool = True,
        target_date: date = None
    ):
        """
        Refresh a rollup table.

        Incremental: Only refresh specific date partition
        Full: Rebuild entire rollup
        """

        rollup = self.rollups[rollup_name]

        if incremental and target_date:
            # Delete and re-insert for specific date
            self.db.execute(f"""
                DELETE FROM {rollup.name}
                WHERE date = '{target_date}'
            """)

            dimension_cols = ", ".join(rollup.dimensions)
            measure_cols = ", ".join([
                f"{agg}({col}) as {col}_{agg.lower()}"
                for col, agg in rollup.measures.items()
            ])

            self.db.execute(f"""
                INSERT INTO {rollup.name}
                SELECT
                    {dimension_cols},
                    {measure_cols},
                    CURRENT_TIMESTAMP as refreshed_at
                FROM {rollup.source_table}
                WHERE date = '{target_date}'
                GROUP BY {dimension_cols}
            """)
        else:
            # Full refresh - recreate
            self.db.execute(f"DROP TABLE IF EXISTS {rollup.name}")
            self.create_rollup(rollup)

    def get_best_rollup_for_query(
        self,
        dimensions_needed: List[str],
        time_granularity: str
    ) -> Optional[str]:
        """
        Find the most efficient rollup for a query.

        Returns rollup name or None if should use base table.
        """

        candidates = []

        for name, rollup in self.rollups.items():
            # Check if rollup has all needed dimensions
            if all(d in rollup.dimensions for d in dimensions_needed):
                # Check if granularity matches
                if self._matches_granularity(rollup, time_granularity):
                    candidates.append((name, len(rollup.dimensions)))

        if not candidates:
            return None

        # Return rollup with fewest dimensions (most aggregated)
        candidates.sort(key=lambda x: x[1])
        return candidates[0][0]

    def _matches_granularity(self, rollup: RollupDefinition, granularity: str) -> bool:
        """Check if rollup supports the requested time granularity."""

        granularity_hierarchy = ["hour", "day", "week", "month", "quarter", "year"]

        rollup_granularity = "day"  # Default
        for dim in rollup.dimensions:
            if dim in granularity_hierarchy:
                rollup_granularity = dim
                break

        # Rollup must be at same or finer granularity
        return granularity_hierarchy.index(rollup_granularity) <= \
granularity_hierarchy.index(granularity)| Value | |
|---|---|
| fact_sales (§2.1) | ~11 billion rows, ~2 TB → ~180 bytes a row |
| No partition pruning | full scan: ~11 billion rows, ~2 TB |
| Daily partitions, 90 days | 90 × 30 million = 2.7 billion rows, ~490 GB of whole rows |
| Plus column pruning (the preface's figure) | 50 GB+ read and shuffled |
From agg_daily_sales (1,000 combinations) |
90 × 1,000 = 90,000 rows |
| Rollup row size (assumed) | 50 bytes → ~4.5 MB |
Conclusion: partitioning cuts the scan about 4× and column pruning about 10× more, but the query still moves 50 GB. Only the rollup removes the 30,000× of rows the dashboard never needed, which is what turns 47 seconds into milliseconds.
4.3 Materialized Views#
Materialized Views
- Auto-refresh (database manages)
- Query optimizer can use automatically
- May have limitations on supported queries
- Less control over refresh timing
Rollup Tables
- Manual refresh (you control)
- Must explicitly query the rollup
- Full SQL flexibility
- More control, more responsibility
Snowflake materialized views
CREATE MATERIALIZED VIEW mv_daily_revenue AS
SELECT
    DATE_TRUNC('day', order_timestamp) as date,
    product_category,
    SUM(revenue) as total_revenue,
    COUNT(*) as order_count
FROM fact_sales
GROUP BY 1, 2;

-- Snowflake automatically:
-- 1. Keeps view in sync with base table
-- 2. Uses view when query matches pattern
-- 3. Charges for storage and maintenance
BigQuery materialized views
CREATE MATERIALIZED VIEW project.dataset.mv_daily_revenue
OPTIONS (
    enable_refresh = true,
    refresh_interval_minutes = 60
)
AS
SELECT
    DATE(order_timestamp) as date,
    product_category,
    SUM(revenue) as total_revenue,
    COUNT(*) as order_count
FROM project.dataset.fact_sales
GROUP BY 1, 2;

-- BigQuery automatically:
-- 1. Incrementally refreshes
-- 2. Rewrites queries to use MV
-- 3. Combines MV + base table for fresh data
ClickHouse materialized views
-- ClickHouse MVs are triggers that populate a target table
CREATE MATERIALIZED VIEW mv_daily_revenue
ENGINE = SummingMergeTree()
ORDER BY (date, category)
AS
SELECT
    toDate(order_timestamp) as date,
    category,
    sum(revenue) as total_revenue,
    count() as order_count
FROM fact_sales
GROUP BY date, category;

-- ClickHouse:
-- 1. Populates MV on INSERT to source (each insert block aggregated separately)
-- 2. SummingMergeTree sums rows with the same key during background merges
--    (eventually), so still query with sum(...) GROUP BY date, category
-- 3. No automatic query rewrite - query MV directly# query_optimization/materialized_views.py
"""
Materialized view strategies for different databases.
"""
from typing import Dict
class MaterializedViewManager:
"""
Manages materialized views with freshness tracking.
"""
def __init__(self, db_connection):
self.db = db_connection
self.views: Dict[str, Dict] = {}
def create_view(
self,
name: str,
query: str,
refresh_interval_minutes: int = 60
):
"""Create a materialized view."""
# Create the view
self.db.execute(f"""
CREATE MATERIALIZED VIEW {name} AS
{query}
""")
self.views[name] = {
"query": query,
"refresh_interval": refresh_interval_minutes,
"last_refresh": None,
"row_count": 0
}
def get_freshness(self, name: str) -> Dict:
"""Get view freshness information."""
if name not in self.views:
return {"error": "View not found"}
view = self.views[name]
# Query for actual freshness
result = self.db.execute(f"""
SELECT
COUNT(*) as row_count,
MAX(refreshed_at) as last_refresh
FROM {name}
""")
return {
"name": name,
"last_refresh": result["last_refresh"],
"row_count": result["row_count"],
"refresh_interval_minutes": view["refresh_interval"],
"is_stale": self._is_stale(result["last_refresh"], view["refresh_interval"])
}
def _is_stale(self, last_refresh, interval_minutes: int) -> bool:
"""Check if view is stale."""
if not last_refresh:
return True
from datetime import datetime, timedelta, timezone
threshold = datetime.now(timezone.utc) - timedelta(minutes=interval_minutes)
return last_refresh < thresholdChapter 5: Caching Strategies#
Cache everything for a day?
To take load off the warehouse, someone proposes caching every query result for 24 hours. What breaks, and what would you do instead?
One strong answer
- Stale live numbers: a "today" panel would show hours-old data while everyone thinks it's live.
- Invalidation and memory: you end up flushing entries by hand whenever data changes, and the cache fills with results nobody asks for again.
- Instead: set TTLs by how fast the data changes (about a minute for today, hours for closed periods), and add event-based invalidation where the data changes rarely. That hybrid is the common production choice.
5.1 Multi-Layer Caching#
Caching architecture
| Layer | Cache | Key / managed by | TTL | Hit rate |
|---|---|---|---|---|
| 1: CDN / Edge Cache | Static dashboard HTML/JS | — | Hours to days | 95%+ for static assets |
| 2: API Response Cache (Redis) | Query results as JSON | Key: Hash of query + parameters | Minutes to hours | 60-80% for popular queries |
| 3: Query Result Cache (Database) | Query results in DB memory | Managed by: Database query cache | Until invalidation | Varies by database |
| 4: Block/Page Cache (Storage) | Data blocks in memory | Managed by: OS or database | — | High for repeated scans |
Cache invalidation strategies
| Strategy | How | Good for | Risk |
|---|---|---|---|
| 1. TIME-BASED (TTL) | Simple: Expire after X minutes | Dashboards that can be slightly stale | Serving outdated data |
| 2. EVENT-BASED | Invalidate when source data changes | Data that changes infrequently | Complex to implement correctly |
| 3. VERSION-BASED | Include data version in cache key | Point-in-time queries | Cache bloat with many versions |
| 4. HYBRID | TTL + event-based invalidation | Best of both worlds | — Most common in production |
5.2 Query Result Caching#
# query_optimization/caching.py

"""
Query result caching implementation.
"""

from dataclasses import dataclass
from datetime import datetime, timedelta, timezone
from typing import Dict, Any, Optional
import hashlib
import json
import redis


@dataclass
class CacheConfig:
    """Cache configuration."""
    default_ttl_seconds: int = 300  # 5 minutes
    max_result_size_mb: int = 10
    redis_url: str = "redis://localhost:6379"


class QueryCache:
    """
    Caches query results for fast repeated access.
    """

    def __init__(self, config: CacheConfig):
        self.config = config
        self.redis = redis.from_url(config.redis_url)

        # Metrics
        self.hits = 0
        self.misses = 0

    def get(self, query: str, params: Dict = None) -> Optional[Dict]:
        """
        Get cached result for query.

        Returns None if not cached or expired.
        """

        cache_key = self._make_key(query, params)

        cached = self.redis.get(cache_key)

        if cached:
            self.hits += 1
            result = json.loads(cached)
            result["_cache"] = {
                "hit": True,
                "cached_at": result.get("_cached_at"),
                "key": cache_key[:20] + "..."
            }
            return result

        self.misses += 1
        return None

    def set(
        self,
        query: str,
        params: Dict,
        result: Dict,
        ttl_seconds: int = None
    ):
        """
        Cache a query result.
        """

        cache_key = self._make_key(query, params)
        ttl = ttl_seconds or self.config.default_ttl_seconds

        # Add metadata
        result["_cached_at"] = datetime.now(timezone.utc).isoformat()

        # Check size
        result_json = json.dumps(result)
        size_mb = len(result_json) / (1024 * 1024)

        if size_mb > self.config.max_result_size_mb:
            # Too large to cache
            return False

        self.redis.setex(cache_key, ttl, result_json)
        return True

    def invalidate(self, pattern: str = None, query: str = None):
        """
        Invalidate cached results.

        pattern: Redis key pattern (e.g., "query:sales:*")
        query: Specific query to invalidate
        """

        if query:
            cache_key = self._make_key(query, {})
            # Drops the entry cached with no params only: the key is a hash
            # that includes params, so other variants have different keys.
            # (SCAN, not KEYS: KEYS is O(N) and blocks Redis while it runs.)
            keys = list(self.redis.scan_iter(match=f"{cache_key}*"))
            if keys:
                self.redis.unlink(*keys)

        elif pattern:
            keys = list(self.redis.scan_iter(match=pattern))
            if keys:
                self.redis.unlink(*keys)

    def _make_key(self, query: str, params: Dict = None) -> str:
        """Generate cache key from query and params."""

        # Normalize query
        normalized = " ".join(query.lower().split())

        # Include params in key
        key_data = {
            "query": normalized,
            "params": params or {}
        }

        key_hash = hashlib.sha256(
            json.dumps(key_data, sort_keys=True).encode()
        ).hexdigest()[:16]

        return f"query:{key_hash}"

    def get_stats(self) -> Dict:
        """Get cache statistics."""

        total = self.hits + self.misses

        return {
            "hits": self.hits,
            "misses": self.misses,
            "hit_rate": self.hits / total if total > 0 else 0,
            "total_requests": total
        }


class SmartQueryCache(QueryCache):
    """
    Smart caching with query-specific TTLs and warming.
    """

    def __init__(self, config: CacheConfig):
        super().__init__(config)

        # Query-specific TTL rules
        self.ttl_rules = {
            "realtime": 60,       # 1 minute for real-time queries
            "hourly": 300,        # 5 minutes for hourly data
            "daily": 3600,        # 1 hour for daily data
            "historical": 86400,  # 24 hours for historical
        }

    def get_ttl_for_query(self, query: str, params: Dict) -> int:
        """Determine appropriate TTL based on query characteristics."""

        query_lower = query.lower()

        # Real-time queries (today's data)
        if "today" in query_lower or "current" in query_lower:
            return self.ttl_rules["realtime"]

        # Check date range in params
        if params:
            if "date" in params:
                date_param = params["date"]
                # If querying old data, cache longer
                if isinstance(date_param, str) and date_param < "2024-01-01":
                    return self.ttl_rules["historical"]

        # Default to daily TTL
        return self.ttl_rules["daily"]

    async def warm_cache(self, queries: list):
        """
        Pre-warm cache with common queries.

        Run during off-peak hours.
        """

        for query_def in queries:
            query = query_def["query"]
            params = query_def.get("params", {})

            # Execute query and cache result
            result = await self._execute_query(query, params)

            ttl = self.get_ttl_for_query(query, params)
            self.set(query, params, result, ttl)

    async def _execute_query(self, query: str, params: Dict) -> Dict:
        """Execute query against database."""
        # Implementation depends on database
passPre-aggregation and caching
Q1/3 An analyst runs "revenue by product by hour by region" two or three times a month, slicing by different dimensions each time. What does the decision framework suggest?
Answer & explanation
Answer: A
The pattern is neither predictable nor frequent, so a 45-second query a few times a month is acceptable. Rollups pay off for repeated, predictable queries like the executive dashboard; building one for shifting ad-hoc dimensions costs storage and refresh work for almost no hits.
Q2/3 You keep hourly (8.76M rows), daily (365K rows) and monthly (12K rows) rollups. A dashboard asks for "last 90 days by day". Which table should the router use?
Answer & explanation
Answer: B
Route to the most aggregated table that still matches the requested granularity. Hourly would give the right answer but scans about 24x more rows. Monthly is smaller but cannot produce a per-day breakdown, and the rollups are already exact sums, so going to raw facts buys nothing.
Q3/3 One Redis cache serves a "today's live metrics" panel and a report on last year's data. Which TTL policy matches the lesson?
Answer & explanation
Answer: C
TTL should follow how fast the underlying data changes: today's numbers move constantly, while closed historical periods barely change. One long TTL for everything is the over-caching mistake, because the live panel would show stale numbers for hours.
Chapter 6: Multi-Tenant Analytics#
6.1 Tenant Isolation Strategies#
Pattern 1: Row-level security
Single table with tenant_id column:
| tenant_id | date | product | revenue |
|---|---|---|---|
| tenant_a | ... | ... | ... |
| tenant_b | ... | ... | ... |
Query filter:
SELECT * FROM fact_sales WHERE tenant_id = :current_tenant- Pros: Simple to implement · Easy to add new tenants · Shared resources = lower cost
- Cons: Risk of data leakage (forgot WHERE clause) · Noisy neighbor (one tenant's queries affect others) · Scaling limits
Pattern 2: Schema per tenant
Separate schema for each tenant: tenant_a.fact_sales, tenant_b.fact_sales, tenant_c.fact_sales
Query:
SELECT * FROM {tenant_schema}.fact_sales- Pros: Strong isolation · Easy per-tenant customization · Simple backup/restore per tenant
- Cons: Schema proliferation · Harder to query across tenants · More maintenance
Pattern 3: Database per tenant
Completely separate databases:
-
analytics_tenant_a(ClickHouse cluster 1) -
analytics_tenant_b(ClickHouse cluster 2) -
Pros: Complete isolation · Independent scaling · Compliance-friendly (data residency)
-
Cons: Highest cost · Most operational complexity · No cross-tenant analytics
How tenants hurt each other in one table
All tenants share one fact table with a tenant_id column. Name two ways one tenant can hurt another, and the fix for each.
One strong answer
- Leakage: one query without
WHERE tenant_id = ...returns everyone's rows. Enforce row-level security in the database instead of trusting every query. - Noisy neighbour: one tenant's heavy queries slow everyone's dashboards. Give each tenant quotas on concurrent queries, bytes scanned a day and query time.
- When that isn't enough: a schema or a database per tenant gives stronger isolation, at the price of more maintenance and cost.
6.2 Resource Management#
# query_optimization/multi_tenant.py

"""
Multi-tenant query management with fair resource allocation.
"""

from dataclasses import dataclass
from datetime import datetime, timedelta, timezone
from typing import Dict, Optional
import asyncio


@dataclass
class TenantQuota:
    """Resource quota for a tenant."""
    max_concurrent_queries: int = 10
    max_scanned_bytes_per_day: int = 100 * 1024**3  # 100GB
    max_query_timeout_seconds: int = 300
    priority: int = 1  # Higher = more priority


class TenantResourceManager:
    """
    Manages query resources across tenants fairly.
    """

    def __init__(self):
        self.quotas: Dict[str, TenantQuota] = {}
        self.usage: Dict[str, Dict] = {}
        self.active_queries: Dict[str, int] = {}

    def register_tenant(self, tenant_id: str, quota: TenantQuota):
        """Register a tenant with their quota."""
        self.quotas[tenant_id] = quota
        self.usage[tenant_id] = {
            "bytes_scanned_today": 0,
            "queries_today": 0,
            "last_reset": datetime.now(timezone.utc).date()
        }
        self.active_queries[tenant_id] = 0

    async def acquire_query_slot(self, tenant_id: str) -> bool:
        """
        Try to acquire a query slot for tenant.

        Returns False if quota exceeded.
        """

        self._maybe_reset_daily_usage(tenant_id)

        quota = self.quotas.get(tenant_id)
        if not quota:
            return False

        # Check concurrent query limit
        if self.active_queries[tenant_id] >= quota.max_concurrent_queries:
            return False

        # Check daily byte limit
        if self.usage[tenant_id]["bytes_scanned_today"] >= quota.max_scanned_bytes_per_day:
            return False

        self.active_queries[tenant_id] += 1
        return True

    def release_query_slot(self, tenant_id: str, bytes_scanned: int):
        """Release query slot and record usage."""

        self.active_queries[tenant_id] -= 1
        self.usage[tenant_id]["bytes_scanned_today"] += bytes_scanned
        self.usage[tenant_id]["queries_today"] += 1

    def get_query_timeout(self, tenant_id: str) -> int:
        """Get query timeout for tenant."""
        quota = self.quotas.get(tenant_id)
        return quota.max_query_timeout_seconds if quota else 60

    def _maybe_reset_daily_usage(self, tenant_id: str):
        """Reset usage counters if new day."""
        today = datetime.now(timezone.utc).date()
        if self.usage[tenant_id]["last_reset"] < today:
            self.usage[tenant_id] = {
                "bytes_scanned_today": 0,
                "queries_today": 0,
                "last_reset": today
            }

    def get_usage_report(self, tenant_id: str) -> Dict:
        """Get usage report for tenant."""

        self._maybe_reset_daily_usage(tenant_id)

        quota = self.quotas.get(tenant_id)
        usage = self.usage.get(tenant_id, {})

        return {
            "tenant_id": tenant_id,
            "today": {
                "bytes_scanned": usage.get("bytes_scanned_today", 0),
                "bytes_limit": quota.max_scanned_bytes_per_day if quota else 0,
                "bytes_remaining": max(0,
                    (quota.max_scanned_bytes_per_day if quota else 0) -
                    usage.get("bytes_scanned_today", 0)
                ),
                "queries_executed": usage.get("queries_today", 0)
            },
            "active_queries": self.active_queries.get(tenant_id, 0),
            "max_concurrent": quota.max_concurrent_queries if quota else 0
        }


class QueryRouter:
    """
    Routes queries to appropriate resources based on tenant and query type.
    """

    def __init__(
        self,
        resource_manager: TenantResourceManager,
        query_cache: QueryCache
    ):
        self.resources = resource_manager
        self.cache = query_cache

        # Query executors by type
        self.executors = {}

    async def execute_query(
        self,
        tenant_id: str,
        query: str,
        params: Dict = None
    ) -> Dict:
        """
        Execute query with tenant isolation and resource management.
        """

        # Check cache first
        cached = self.cache.get(f"{tenant_id}:{query}", params)
        if cached:
            return cached

        # Acquire resources
        if not await self.resources.acquire_query_slot(tenant_id):
            return {
                "error": "Resource quota exceeded",
                "retry_after_seconds": 60
            }

        try:
            # Get timeout for tenant
            timeout = self.resources.get_query_timeout(tenant_id)

            # Execute with timeout
            result = await asyncio.wait_for(
                self._execute(tenant_id, query, params),
                timeout=timeout
            )

            # Cache result
            self.cache.set(f"{tenant_id}:{query}", params, result)

            # Release resources
            bytes_scanned = result.get("_metadata", {}).get("bytes_scanned", 0)
            self.resources.release_query_slot(tenant_id, bytes_scanned)

            return result

        except asyncio.TimeoutError:
            self.resources.release_query_slot(tenant_id, 0)
            return {"error": f"Query timeout after {timeout}s"}

        except Exception as e:
            self.resources.release_query_slot(tenant_id, 0)
            raise

    async def _execute(self, tenant_id: str, query: str, params: Dict) -> Dict:
        """Execute query with tenant context."""

        # Add tenant filter to query
        safe_query = self._add_tenant_filter(query, tenant_id)

        # Route to appropriate executor
        executor = self._get_executor(query)

        return await executor.execute(safe_query, params)

    def _add_tenant_filter(self, query: str, tenant_id: str) -> str:
        """
        Add tenant filter to query for row-level security.

        In production, use database-level RLS instead.
        """

        # Simple approach - inject WHERE clause
        # WARNING: This is simplified - use parameterized queries!
        if "WHERE" in query.upper():
            return query.replace("WHERE", f"WHERE tenant_id = '{tenant_id}' AND")
        else:
            # Find insertion point
            return query + f" WHERE tenant_id = '{tenant_id}'"

    def _get_executor(self, query: str):
        """Get appropriate executor based on query type."""

        query_lower = query.lower()

        if "sum(" in query_lower or "count(" in query_lower:
            return self.executors.get("olap", self.executors["default"])

return self.executors["default"]Multi-tenant analytics
Q1/3 Which risk is specific to the row-level security pattern (one shared table with a
tenant_idcolumn)?Answer & explanation
Answer: D
In a shared table, isolation depends on every query carrying
WHERE tenant_id = .... Miss it once and you return everyone's rows. Schema proliferation belongs to schema-per-tenant, and the highest cost plus no cross-tenant analytics belong to database-per-tenant.Q2/3 One tenant fires dozens of heavy queries and every other tenant's dashboards slow down. Which mechanism from the lesson targets this directly?
Answer & explanation
Answer: A
The noisy-neighbor problem is about shared compute, so you cap what each tenant can consume: concurrency slots, bytes per day and timeouts. A separate schema on the same cluster isolates data, not compute, so the heavy queries still compete for the same resources.
Q3/3 In
QueryRouter.execute_query, suppose the timeout branch forgot to callrelease_query_slot. What happens over time?Answer & explanation
Answer: C
acquire_query_slotincrements the active count and onlyrelease_query_slotdecrements it. Each leaked slot permanently uses up concurrency. The daily reset only clears bytes scanned and the query count, notactive_queries, so the tenant would end up locked out.
Part II: Implementation#
Chapter 7: Production Query Service#
7.1 Complete Query Service#
# query_optimization/query_service.py

"""
Production query service with all optimizations.
"""

from dataclasses import dataclass
from datetime import datetime, timezone
from typing import Dict, Any, List, Optional
import logging

logger = logging.getLogger(__name__)


@dataclass
class QueryServiceConfig:
    """Query service configuration."""
    cache_enabled: bool = True
    cache_ttl_seconds: int = 300
    max_result_rows: int = 10000
    default_timeout_seconds: int = 30
    enable_query_rewriting: bool = True


class QueryService:
    """
    Production query service with caching, optimization, and monitoring.
    """

    def __init__(
        self,
        config: QueryServiceConfig,
        cache: QueryCache,
        rollup_manager: RollupManager,
        resource_manager: TenantResourceManager,
        db_connection
    ):
        self.config = config
        self.cache = cache
        self.rollups = rollup_manager
        self.resources = resource_manager
        self.db = db_connection

        # Metrics
        self.query_count = 0
        self.cache_hits = 0
        self.rollup_hits = 0
        self.avg_latency_ms = 0

    async def execute(
        self,
        tenant_id: str,
        query: str,
        params: Dict = None,
        options: Dict = None
    ) -> Dict:
        """
        Execute query with full optimization pipeline.

        Pipeline:
        1. Check cache
        2. Acquire resources
        3. Rewrite query (use rollups)
        4. Execute
        5. Cache result
        6. Return with metadata
        """

        start_time = datetime.now(timezone.utc)
        self.query_count += 1

        options = options or {}
        result_metadata = {
            "query_id": f"q_{self.query_count}_{start_time.timestamp()}",
            "tenant_id": tenant_id,
            "cache_hit": False,
            "rollup_used": None,
            "bytes_scanned": 0
        }

        try:
            # Step 1: Check cache
            if self.config.cache_enabled and not options.get("skip_cache"):
                cache_key = f"{tenant_id}:{query}"
                cached = self.cache.get(cache_key, params)

                if cached:
                    self.cache_hits += 1
                    result_metadata["cache_hit"] = True
                    result_metadata["latency_ms"] = self._elapsed_ms(start_time)
                    return self._format_response(cached, result_metadata)

            # Step 2: Acquire resources
            if not await self.resources.acquire_query_slot(tenant_id):
                return self._quota_exceeded_response(tenant_id)

            try:
                # Step 3: Query rewriting
                optimized_query = query
                if self.config.enable_query_rewriting:
                    optimized_query, rollup_used = self._try_rewrite_to_rollup(
                        query, params
                    )
                    if rollup_used:
                        self.rollup_hits += 1
                        result_metadata["rollup_used"] = rollup_used

                # Step 4: Add tenant filter
                safe_query = self._add_tenant_filter(optimized_query, tenant_id)

                # Step 5: Execute with timeout
                timeout = options.get("timeout", self.config.default_timeout_seconds)
                result = await self._execute_query(safe_query, params, timeout)

                result_metadata["bytes_scanned"] = result.get("_bytes_scanned", 0)
                result_metadata["rows_returned"] = len(result.get("data", []))

                # Step 6: Cache result
                if self.config.cache_enabled:
                    ttl = self._get_cache_ttl(query, params)
                    self.cache.set(f"{tenant_id}:{query}", params, result, ttl)

                # Release resources
                self.resources.release_query_slot(
                    tenant_id,
                    result_metadata["bytes_scanned"]
                )

                result_metadata["latency_ms"] = self._elapsed_ms(start_time)
                self._update_avg_latency(result_metadata["latency_ms"])

                return self._format_response(result, result_metadata)

            except Exception as e:
                self.resources.release_query_slot(tenant_id, 0)
                raise

        except Exception as e:
            logger.error(f"Query execution failed: {e}", exc_info=True)
            result_metadata["latency_ms"] = self._elapsed_ms(start_time)
            result_metadata["error"] = str(e)
            return self._error_response(e, result_metadata)

    def _try_rewrite_to_rollup(
        self,
        query: str,
        params: Dict
    ) -> tuple:
        """
        Try to rewrite query to use a rollup table.

        Returns (rewritten_query, rollup_name) or (original_query, None)
        """

        # Parse query to understand dimensions and granularity
        dimensions = self._extract_dimensions(query)
        granularity = self._extract_time_granularity(query, params)

        # Find best rollup
        rollup_name = self.rollups.get_best_rollup_for_query(
            dimensions, granularity
        )

        if rollup_name:
            # Rewrite query to use rollup
            rewritten = self._rewrite_query_for_rollup(query, rollup_name)
            return rewritten, rollup_name

        return query, None

    def _extract_dimensions(self, query: str) -> List[str]:
        """Extract GROUP BY dimensions from query."""

        # Simplified parsing - use proper SQL parser in production
        query_upper = query.upper()

        if "GROUP BY" not in query_upper:
            return []

        group_by_idx = query_upper.index("GROUP BY")
        group_by_clause = query[group_by_idx + 8:].split("ORDER BY")[0].split("LIMIT")[0]

        dimensions = [d.strip() for d in group_by_clause.split(",")]
        return dimensions

    def _extract_time_granularity(self, query: str, params: Dict) -> str:
        """Determine time granularity of query."""

        query_lower = query.lower()

        if "hour" in query_lower or "hourly" in query_lower:
            return "hour"
        elif "day" in query_lower or "daily" in query_lower:
            return "day"
        elif "week" in query_lower or "weekly" in query_lower:
            return "week"
        elif "month" in query_lower or "monthly" in query_lower:
            return "month"

        return "day"  # Default

    def _rewrite_query_for_rollup(self, query: str, rollup_name: str) -> str:
        """Rewrite query to use rollup table."""

        # Replace fact table with rollup
        # Simplified - use proper SQL rewriting in production
        rewritten = query.replace("fact_sales", rollup_name)
        rewritten = rewritten.replace("fact_orders", rollup_name)

        return rewritten

    def _add_tenant_filter(self, query: str, tenant_id: str) -> str:
        """Add tenant isolation filter."""

        # In production, use database-level RLS
        # This is a simplified approach

        if "WHERE" in query.upper():
            # Insert after WHERE
            where_idx = query.upper().index("WHERE")
            return (
                query[:where_idx + 5] +
                f" tenant_id = '{tenant_id}' AND" +
                query[where_idx + 5:]
            )
        else:
            # Add WHERE clause
            # Find safe insertion point
            for keyword in ["GROUP BY", "ORDER BY", "LIMIT", ";"]:
                if keyword in query.upper():
                    idx = query.upper().index(keyword)
                    return (
                        query[:idx] +
                        f" WHERE tenant_id = '{tenant_id}' " +
                        query[idx:]
                    )

            return query + f" WHERE tenant_id = '{tenant_id}'"

    async def _execute_query(
        self,
        query: str,
        params: Dict,
        timeout: int
    ) -> Dict:
        """Execute query against database."""

        # Add LIMIT if not present
        if "LIMIT" not in query.upper():
            query = query + f" LIMIT {self.config.max_result_rows}"

        # Execute with parameterized query
        result = await self.db.execute(query, params, timeout=timeout)

        return result

    def _get_cache_ttl(self, query: str, params: Dict) -> int:
        """Determine cache TTL based on query characteristics."""

        query_lower = query.lower()

        # Real-time queries: short TTL
        if "today" in query_lower or "last_hour" in query_lower:
            return 60

        # Historical queries: long TTL
        if params and params.get("end_date", "").startswith("2023"):
            return 3600

        return self.config.cache_ttl_seconds

    def _elapsed_ms(self, start: datetime) -> int:
        """Calculate elapsed time in milliseconds."""
        return int((datetime.now(timezone.utc) - start).total_seconds() * 1000)

    def _update_avg_latency(self, latency_ms: int):
        """Update rolling average latency."""
        # Simple exponential moving average
        alpha = 0.1
        self.avg_latency_ms = alpha * latency_ms + (1 - alpha) * self.avg_latency_ms

    def _format_response(self, result: Dict, metadata: Dict) -> Dict:
        """Format successful response."""
        return {
            "data": result.get("data", []),
            "metadata": metadata,
            "status": "success"
        }

    def _error_response(self, error: Exception, metadata: Dict) -> Dict:
        """Format error response."""
        return {
            "data": [],
            "metadata": metadata,
            "status": "error",
            "error": {
                "type": type(error).__name__,
                "message": str(error)
            }
        }

    def _quota_exceeded_response(self, tenant_id: str) -> Dict:
        """Format quota exceeded response."""
        usage = self.resources.get_usage_report(tenant_id)

        return {
            "data": [],
            "metadata": {"tenant_id": tenant_id},
            "status": "error",
            "error": {
                "type": "QuotaExceeded",
                "message": "Query quota exceeded",
                "usage": usage,
                "retry_after_seconds": 60
            }
        }

    def get_stats(self) -> Dict:
        """Get service statistics."""
        return {
            "total_queries": self.query_count,
            "cache_hit_rate": self.cache_hits / self.query_count if self.query_count > 0 else 0,
            "rollup_hit_rate": self.rollup_hits / self.query_count if self.query_count > 0 else 0,
            "avg_latency_ms": self.avg_latency_ms,
            "cache_stats": self.cache.get_stats()
}Production query service
Q1/3 In
QueryService.execute, why is the cache checked before acquiring a tenant's query slot?Answer & explanation
Answer: B
A hit returns immediately with zero bytes scanned. Charging it against concurrency or byte quotas would throttle tenants for work the database never did. The order of operations is about cost and latency; there is no link between slots and cache keys.
Q2/3 The service caches results under
f"{tenant_id}:{query}"rather than just the query text. Why?Answer & explanation
Answer: D
The tenant filter is injected after the cache lookup, so two tenants sending identical SQL get different results. A key without the tenant would serve tenant A's data to tenant B. Prefixing actually lowers sharing across tenants; the point is correctness, not hit rate.
Q3/3
_add_tenant_filterinsertstenant_id = 'x' ANDright afterWHERE. A user sends... WHERE region = 'US' OR region = 'EU'. What goes wrong?Answer & explanation
Answer: A
The result is
tenant_id = 'x' AND region = 'US' OR region = 'EU', which reads as(tenant AND US) OR EUand leaks other tenants' EU data. This is why the lesson calls string injection "simplified" and says to use database-level row-level security in production.
Part III: Real-World Application#
Chapter 8: Case Studies#
8.1 Amplitude's Query Engine#
Challenge
- Thousands of customers
- Trillions of events
- Sub-second query responses
- Complex behavioral analytics (funnels, retention)
Architecture: Amplitude Nova engine (simplified)
| Area | Design |
|---|---|
| Ingestion | Real-time events → Nova, Amplitude's in-house distributed columnar engine (inspired by Druid, PowerDrill, Scuba) · Data partitioned by user so code moves to the data |
| Query Optimization | Pre-computed metrics per customer · Materialized views for common charts · Multi-level caching (edge, API, database) |
| Multi-tenancy | Logical isolation (tenant_id column) · Per-tenant query quotas · Priority queues (paid tiers get priority) · Resource pools per customer size |
| Key Innovation: BEHAVIORAL PRE-COMPUTATION | Pre-compute common metrics (DAU, WAU, MAU) · Pre-build funnel snapshots nightly · Retention matrices updated hourly · Custom dashboards compile to optimized queries |
Results (per Amplitude's engineering blog)
- Nova 2.0 re-architecture: about 3x better p95 latency
- About 10% lower server cost
8.2 Mixpanel's JQL Engine#
Mixpanel's docs now list JQL as in maintenance mode and recommend its other query tools for new work; the design below is still a good example of a sandboxed query language.
Challenge
- Flexible query language for analysts
- Interactive exploration (fast iteration)
- Massive scale (billions of events)
Solution: Arb, Mixpanel's in-house columnar store
| Area | Design |
|---|---|
| Query Language | JQL: JavaScript-like syntax for flexibility · Compiles to optimized execution plan · Sandboxed execution for safety |
| Storage | Custom columnar format (not Parquet) · Per-project data isolation · Time-partitioned with custom indexing · Compression optimized for event data |
| Query Execution | Query planner rewrites to optimal form · Predicate pushdown to storage layer · Parallel execution across partitions · Streaming results (don't wait for full result) |
| Optimization Tricks | Sampling for exploration (fast approximate) · Full scan for reports (accurate) · Progressive result loading · Query similarity detection for caching |
Chapter 9: Common Mistakes#
9.1 Query Optimization Mistakes#
Mistake 1: Over-Caching
Wrong:
# Cache everything for 24 hours
cache.set(query, result, ttl=86400)
Problem:
- Stale data shown to users
- Cache invalidation nightmares
- Memory bloat
Right:
# TTL based on data freshness requirements
if is_realtime_query(query):
    cache.set(query, result, ttl=60)
elif is_historical_query(query):
    cache.set(query, result, ttl=3600)
Mistake 2: Wrong Rollup Granularity
Wrong:
# One rollup to rule them all
CREATE TABLE agg_everything AS
SELECT date, category, region, store, product, customer_segment...
GROUP BY ALL
Problem:
- Rollup is as big as fact table
- No query benefit
- Maintenance overhead
Right:
# Purpose-specific rollups
agg_daily_category     -- Executive dashboard
agg_hourly_region      -- Operations
agg_daily_product_top100  -- Product team
Mistake 3: No Query Timeouts
Wrong:
result = db.execute(user_query) # Wait foreverProblem:
- Runaway queries consume resources
- Other users blocked
- Cost explosion
Right:
result = db.execute(
    user_query,
    timeout_seconds=30,
    max_bytes_scanned=10_000_000_000
)
Mistake 4: Ignoring Query Patterns
Wrong:
# Optimize based on intuition
"Let's add an index on product_id"
Problem:
- Index might not be used
- Wasted storage and maintenance
Right:
# Analyze actual query patterns
SELECT query_text, count(*), avg(duration_ms)
FROM query_log
GROUP BY query_text
ORDER BY count(*) DESC
LIMIT 20
-- Then optimize top queries
9.2 Cost Management Mistakes#
Mistake 1: No Cost Visibility
Wrong:
- No idea what queries cost
- Users run expensive queries freely
Problem:
- $50K/month surprise bills
- No accountability
- Can't optimize
Right:
- Track cost per query, per tenant
- Show estimated cost before execution
- Alert on expensive queries
- Dashboard for cost attribution
Mistake 2: Scanning Full Tables
Wrong:
SELECT * FROM fact_sales WHERE product_id = 'P123'
-- No partition filter!
Problem:
- Scans 10TB instead of 10GB
- 1,000x more expensive
Right:
SELECT * FROM fact_sales
WHERE date >= '2024-01-01'  -- Partition pruning
  AND product_id = 'P123'
Mistake 3: SELECT *
Wrong:
SELECT * FROM fact_sales -- 50 columnsProblem:
- Reads unnecessary columns
- Network overhead
- Memory waste
Right:
SELECT date, revenue, quantity  -- Only needed columns
FROM fact_salesCase studies and common mistakes
Q1/3 A team builds one
agg_everythingrollup grouped by date, category, region, store, product and customer segment. Why does it barely speed anything up?Answer & explanation
Answer: C
A rollup only helps when grouping collapses many rows into few. Group by nearly every dimension and almost nothing collapses, so the rollup ends up about as big as the fact table. The fix is purpose-specific rollups, each with just the dimensions one consumer needs.
Q2/3 Mixpanel serves both quick exploration and official reports. How does it balance speed and accuracy?
Answer & explanation
Answer: A
Exploration needs fast iteration, and an approximate answer is fine there. Reports need exact numbers, so they pay for a full scan. Flipping it would make analysts wait on every exploratory tweak while the official numbers come out approximate.
Q3/3 A teammate wants to add an index on
product_idbecause "that's probably what's slow". What does the lesson say to do first?Answer & explanation
Answer: B
Optimizing on intuition risks an unused index that still costs storage and upkeep. A small set of queries usually drives most of the cost, so measure first. A blanket 24-hour TTL is the over-caching mistake, and swapping engines is a large change made without any evidence.
Part IV: Interview Preparation#
Chapter 10: Interview Tips#
10.1 When to Discuss Query Optimization#
| Interview prompt | Bring up |
|---|---|
| "The dashboard is slow" | Caching, pre-aggregation, partitioning |
| "We're paying too much for BigQuery/Snowflake" | Cost optimization, rollups, tiered storage |
| "Design a multi-tenant analytics platform" | Tenant isolation, resource management, fair queuing |
| "How would you handle 10K concurrent dashboard users?" | Caching layers, pre-computation, database choice |
| "Users complain queries take too long" | Query analysis, indexing, materialized views |
10.2 Key Phrases#
- "For dashboard queries, I'd implement a multi-layer caching strategy: CDN for static assets, Redis for query results, and database-level caching. The key is matching TTL to data freshness requirements."
- "Pre-aggregation is crucial for analytics at scale. I'd analyze query patterns to identify the top 20 queries that account for 80% of load, then create rollup tables for those specific patterns."
- "For multi-tenant analytics, I'd use row-level security with tenant_id filtering, combined with per-tenant resource quotas. This prevents noisy neighbor issues while keeping costs manageable."
- "The choice of OLAP database depends on the access pattern. For real-time dashboards with high concurrency, ClickHouse or Druid. For ad-hoc exploration, BigQuery or Snowflake. Often you need both."
Chapter 11: Practice Problems#
Practice · problem 1
Problem 1: Dashboard Performance#
Setup: Your executive dashboard takes 45 seconds to load. It shows:
- Revenue by region by day (last 90 days)
- Top 10 products by revenue
- Conversion funnel by channel
Data: 5B events, 10TB total.
Questions:
- How would you get load time under 1 second?
- How do you keep data fresh while maintaining speed?
- What's your caching invalidation strategy?
Click for hints
- Pre-aggregate all three views as rollup tables
- Refresh rollups every hour (or on schedule)
- Cache rendered dashboard for 5 minutes
- Use streaming for "today" portion
Practice · problem 2
Problem 2: Multi-Tenant Cost Control#
Setup: You have 500 tenants sharing a BigQuery cluster. Three tenants are running expensive queries that cost $10K/month each, while most tenants cost $100/month.
Questions:
- How do you identify the expensive queries?
- How do you implement fair usage without blocking legitimate use?
- How do you communicate limits to tenants?
Click for hints
- Query logging with cost attribution per tenant
- Tiered quotas based on plan (bytes/day, concurrency)
- Pre-query cost estimation with user warning
- Usage dashboard visible to tenants
Chapter 12: Sample Interview Dialogue#
"Our analytics queries are too slow and too expensive. How would you fix this?"
"I'd approach this systematically. First, I need to understand the current state. What's the query latency distribution? What's driving costs? Which queries are most frequent?"
"p50 is 5 seconds, p99 is 60 seconds. Costs are $80K/month on BigQuery. The top 10 queries account for 70% of both time and cost."
"That's actually good news — concentrated pain means concentrated opportunity. For those top 10 queries, I'd do three things:
First, pre-aggregation. If these are dashboard queries hitting the same patterns repeatedly, I'd create materialized views or rollup tables. A query that scans 1TB becomes a query that scans 1GB.
Second, caching. For queries that don't need up-to-the-second freshness, cache results in Redis. A dashboard that 50 people load every morning doesn't need 50 BigQuery scans — one scan, 49 cache hits.
Third, partitioning and clustering. Make sure tables are partitioned by date and clustered by common filter columns. This is table stakes for BigQuery cost control.
For the long tail of queries, I'd implement query governance: byte scan limits, timeout limits, and cost estimation before execution. Users should know 'this query will cost $50 and take 2 minutes' before they run it."
"What about the freshness vs speed trade-off?"
"Great question. I'd segment by use case:
Real-time dashboards (operations): Streaming ingestion to a real-time OLAP like Druid or ClickHouse. Sub-second queries, always fresh. More expensive but worth it for ops.
Business dashboards (executives): Pre-computed views refreshed hourly or daily. They're okay with 'as of this morning' data. Cheap and fast.
Ad-hoc exploration (analysts): Query the raw data when needed. They expect slower queries and accept the cost for flexibility.
The key is matching the architecture to the use case, not trying to make one system do everything optimally."
Summary#
- OLAP database choice
- Cloud warehouses — Snowflake, BigQuery (simple, managed)
- Real-time OLAP — ClickHouse, Druid (fast, concurrent)
- Lake query engines — Trino (flexible, federated)
- Match database to access pattern
- Optimization techniques
- Partitioning — Skip irrelevant files
- Clustering — Group related data
- Pre-aggregation — Compute once, query fast
- Caching — Don't recompute unchanged data
- Query rewriting — Use rollups automatically
- Pre-aggregation
- Analyze query patterns first
- Create purpose-specific rollups
- Hierarchy: hourly → daily → monthly
- Cube pattern for drill-down
- Refresh strategy matters
- Caching strategy
- Multi-layer: CDN → API → Database
- TTL based on freshness needs
- Invalidation: time or event-based
- Warm cache during off-peak
- Monitor hit rates
- Multi-tenancy
- Row-level security — Simple, shared
- Schema per tenant — Isolated, more work
- Database per tenant — Complete isolation, highest cost
- Resource quotas — Fair usage, prevent noisy neighbor
- Cost attribution — Know who's spending what
Key Takeaways#
- KNOW YOUR QUERY PATTERNS — Can't optimize what you don't measure
- PRE-COMPUTE WHAT'S PREDICTABLE — Rollups for dashboards, raw for ad-hoc
- CACHE AGGRESSIVELY, INVALIDATE CAREFULLY — Right TTL is critical
- PARTITION EVERYTHING — Date partitioning is table stakes
- MATCH DATABASE TO USE CASE — No one database does it all
Golden rules
- Analyze before optimizing
- 20% of queries cause 80% of cost
- Pre-aggregate predictable patterns
- Cache with appropriate TTL
- Monitor, iterate, improve
Next: Day 6 — Counting at Scale: Bloom Filters, HyperLogLog, Count-Min Sketch and Top-K
this lesson in shorts · 1
play them all →One idea from this lesson in about a minute each, made for your phone.
Go deeper · reading trail
all reading →Real write-ups from the teams that built these systems. Each opens on the publisher's site in a new tab.
HTTP Analytics for 6M requests per second using ClickHouse
Alex Bocharov · 2018- What
- Cloudflare replaces its Postgres-based analytics pipeline with ClickHouse.
- Key idea
- The old pipeline rolled aggregates up by minute, hour and day in Postgres; the new one feeds a raw requests table and ClickHouse materialized views hold minutely aggregates per breakdown.
- Why here
- The OLAP choices of this lesson in one migration: pre-aggregation, columnar engines and schema design for the queries you serve.
Powering Real-Time Decisions with PhonePe's Garfield Platform and Apache Druid
Nitish Goyal · 2025- What
- PhonePe's real-time event analytics platform built on Apache Druid.
- Key idea
- Druid rolls data up at ingestion (about 5:1), uses sketches for distinct counts and percentiles, and runs active-active across two data centres.
- Why here
- Pre-aggregation and approximate queries from this lesson, tuned for sub-second dashboards.
New lessons by email
New lessons, side quests and case files as they ship, at most once a week. No spam, unsubscribe anytime.
Discussion · …
Public: everyone reading this lesson sees comments. Be kind and keep it on the material.